Data

Sharing consumer complaint data with state agencies

By

We help consumers with complaints about credit cards, mortgages, student loans, checking accounts, savings accounts, credit reporting, bank services, and other consumer loans. Today, we’re announcing plans to share data from those complaints with state regulatory agencies.

This way, multiple government agencies can work on the consumer’s behalf without them having to file complaints with multiple agencies at different levels of government.

By providing real-time access to our growing database of consumer complaints, state government agencies will have a more complete picture of the markets for consumer financial product or services and be able to help more consumers in their state.

We’ll start by sharing our consumer complaints via a secure channel that protects the confidentiality of personally identifiable information. In the future, we’re planning on building ways to accept complaints and information from the agencies as well, and to make the data available to other federal agencies, state attorneys general, local agencies, congressional offices as appropriate, and other governmental organizations like the California Monitor (a program of the California Attorney General) and the Office of Mortgage Settlement Oversight.

What happens when I file a complaint?

When a consumer files a complaint, we screen it to make sure that it’s complete and not a duplicate of another complaint we’re already working on for that consumer. Next, we send it to the company in question and ask them to reply to the complaint within 15 days and expect them to close all but the most complicated complaints within 60 days. After the company responds, we publish a selection of the data (with information identifying the consumer removed) in our public Complaint Database.

The team that works on consumer complaints also works closely with other parts of the Bureau including our Division of Supervision, Enforcement, and Fair Lending and Equal Opportunity to address any potential violations of consumer law.

Our goal in sharing consumer complaints with state agencies is to enhance efficient, transparent, and effective government to better protect American consumers. This new capability is yet another example of the good government principles of cooperation and coordination in action. We look forward to continuing to deepen the already strong relationship we have with our partners.

Scott Pluta is the Assistant Director for the Office of Consumer Response at the Consumer Financial Protection Bureau.

Pushing forward on the CFPB’s financial aid comparison tool

By

This past year, we’ve been working with the Department of Education on a project to help colleges provide clear and comparable financial aid information. Over the course of that project, we learned that more standard information could spur the innovation of apps and digital tools to allow students to better understand their decision to take on all forms of debt, whether it’s a federal student loan, private student loan, credit card, or other financial product.

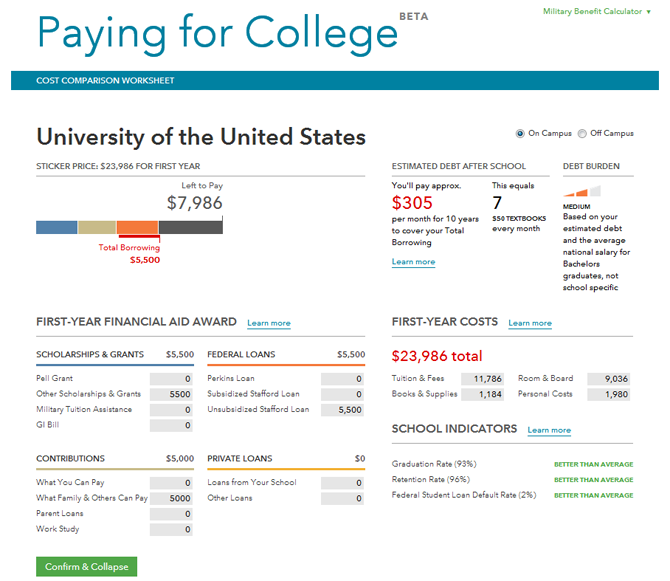
A few months ago, we took a crack at a first version of what a financial aid comparison tool could look like. The beta test of our Financial Aid Comparison Shopper was a success, and we are working hard to launch the full version in the next school year.

Our early prototype was designed to help students and families make smarter choices about financing college, and we asked students, parents, high school counselors, and college financial aid officers to give us their feedback on how to improve the tool.

A survey conducted by an association representing high school counselors found that over 80 percent of their members said the tool was “useful” and that nearly half would recommend the tool to students/families without a single modification. But we think we still have more work to do to build the best tool for students and parents.

For example, we designed the tool for students and families with financial aid offer letters in hand. Based on the feedback we received, some users were trying out the tool to take a guess about what certain colleges might cost them before they’d even applied. Going forward we will need to make sure that users understand the purpose of the financial aid comparison tool and that it complements existing tools offered by others.

A key feature in the beta test that received positive feedback was the “military benefits calculator.” This is an important element for veterans and active-duty servicemembers, and we will be thinking carefully about how to improve it further.

During our beta test we also got some very specific feedback that was especially helpful. For example, some of you told us to include geography if we have a school search, since some colleges have the same name. Others said we should add more “hover overs” to explain more detail about some terms. And perhaps your most common suggestion dealt with how we tried to make the estimated monthly student loan payment relevant to the user. (We converted the amount into “textbooks” as a placeholder, which generated some strong opinions! We now have more ideas on what we might replace it with!)

Here are some next steps for this project:

  • Design: We’re pouring over web analytics about how users interacted with the tool. This will help us figure out what worked well, what was confusing, or what didn’t work.
  • Data: We need to refine what information would be most useful to students and parents in their decision making process. We plan to consult further with some of the higher education data gurus to figure out what would be most helpful.
  • Integration: We also want to figure out how this might interact with existing tools and initiatives offered by government agencies and the private sector. For example, we’ll want to make sure it complements other work, like the financial aid shopping sheet and the proposed college scorecard.

Going forward, we’ll definitely want to share updated designs and functionality to get further feedback. If you’re interested in participating further, please email us at students@cfpb.gov with the subject line “Comparison tool feedback.”

We’ll be sure to include you on our project update list. There will be more opportunities to provide feedback throughout this process, particularly in the areas of design, data, and integration.

Thanks to all of you that have participated in the project so far, and, with your help, we look forward to creating an even better version of the financial-aid comparison tool over the coming months.

Mortgage Disclosure Is Heating Up

By

Previously, we talked about participation by people from locations all over the country in the Know Before You Owe project. Today, we want to share some insights about what we heard – or really, what we saw – from your feedback.

The tool we built let users give us feedback in two basic ways:

  • By looking at our two draft disclosures and picking the one that they thought worked best.
  • By clicking on specific parts of the forms and providing comments on what was or wasn’t helpful.
  • More than 14,000 people submitted a choice between the two forms, and we got more than 13,000 individual comments connected to specific elements of the form. While these comments are not a statistically representative sample of all consumers, they are an invaluable source of information.
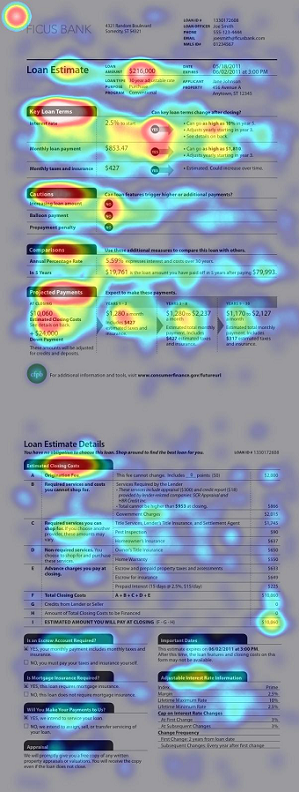
Sample heatmap. Click to view larger.

Sample heatmap from the first round of Know Before You Owe. Click to view larger.

We have compiled these comments, and our Mortgage Disclosure team is reviewing them for insights as they create the next draft of this important form.

We were also able to compile the 13,000+ clicks into something called a heatmap.

Our feedback tool recorded where users clicked as they reviewed the draft disclosures. A heatmap is a way of displaying those clicks as a graphic that shows which areas were clicked on most. Simply put, it’s a way for us to see, at a glance, what areas of our draft disclosures attracted the most and least attention.

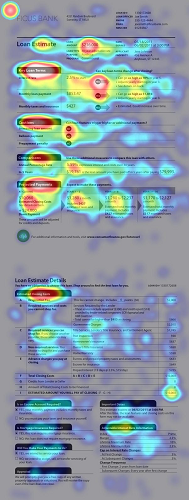
What you see on the right is one of eight heatmaps we made. The white/red sections received the most clicks; the purple/gray sections received the fewest. This particular map aggregates reviews of the “Ficus Bank” form by consumers who said they preferred it to our other prototype, which we labeled “Pecan Bank.”

So, what can this image tell us? Here are a few highlights:

  • Respondents were interested in the bottom line. The full loan amount at the top of the page, the projected payments section at the bottom of the page, and the estimated closing payment on the second page all received a lot of clicks.
  • People had a great deal to say about the “Key Loan Terms” and “Cautions” sections.
  • People commented on the first page of the draft form much more than on the second. This is a pretty common occurrence, and on its own, it serves as helpful advice for our designers about where to put certain important information. But the information on the second page (like closing costs, for example) is also an essential part of mortgage disclosure. That’s why the next round of testing will focus on the second page.

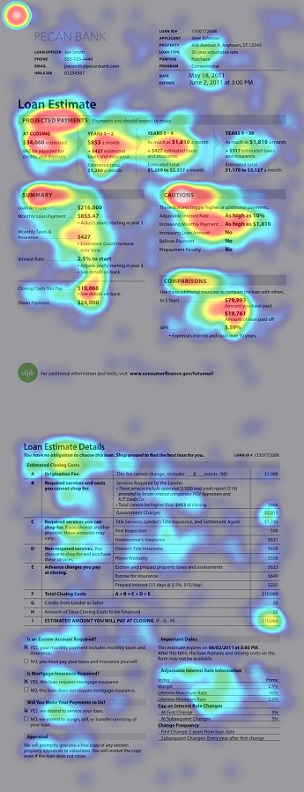
Heatmaps are also easy to compare. Here, for example, are heatmaps of the two forms. These represent clicks from consumers who preferred the form they reviewed:

Sample heatmap. Click to view larger.

Click to view larger. N = 3,676 clicks on the form.

Sample heatmap. Click to view larger.

Click to view larger. N = 2,563 clicks on the form.

These sorts of comparisons can help us see and understand a few things:

  • How the two different formats drew attention to different parts of the form.
  • Differences between what consumers and lenders commented on. (For example, industry reviewers were very interested in applicant or lender information at the top of the form. Consumer reviewers paid less attention to that.)
  • Differences between what positive and negative reviewers noticed on a form.

Of course, heatmaps can only show so much. In this case, the heatmaps raised a number of interesting questions. To find answers, we carefully read and analyzed the comments themselves.

There is symmetry here: heatmaps make it easier to understand and compare data. We want to improve disclosure so it is easier for consumers and lenders to understand and compare when they evaluate mortgage loans. Thanks again to all who provided feedback in helping to move the project forward.

The CARD Act Conference: What We Learned

By

Last month, one year after the date that many CARD Act provisions took effect, the CFPB held a conference on the credit card marketplace. Credit card issuers, credit rating agencies, academics, consumer groups, and federal agencies were all represented. Eight attendees delivered presentations providing a time series look at market changes.

The CFPB has summarized what we learned at the conference with these CARD Act Conference Takeaways. Click through for more detail and to see the actual conference presentations, but here are the basics:

  1. Prior to the CARD Act, there was a wide gap between the initial stated interest rate for a credit card and the actual cost of the credit over time. The CARD Act curtailed certain practices in the credit card industry that created unanticipated costs for consumers. The result has been more transparent pricing: while front end pricing has increased, the overall cost of credit has not.
  2. In 2010, industry income as a percentage of card balances was higher than pre-CARD Act levels. This reflects primarily an improving economy and resulting lower loss rates. That in turn has enabled issuers to release some loss reserves they had set aside to cover expected losses.
  3. In 2007, issuers heavily marketed credit cards as a way to acquire new customers, which included marketing to people with lower credit scores. The recession led issuers to pull back on marketing and raise their credit standards. In 2010, they began to relax again, but standards are still tighter and marketing less prevalent than they were in 2007.
  4. While the cost of credit has remained constant, the use of it has decreased. Credit card debt has dropped by a total of 15 percent over the last two years. The decrease is attributable largely to bad-debt write-offs by card issuers and a marked reduction in new balance creation.

If you’re looking for more details, take a look at our full write-up of the conference findings.

David Silberman is the Assistant Director for Card Markets.

Asking the public about the CARD Act

By

Yesterday’s CARD Act conference commemorated the first anniversary of the day when many provisions of the Credit CARD Act went into effect. Industry executives, leading academics, consumer advocates, government officials, and the CFPB convened to review changes in the card industry since the Act. In conjunction with the conference, the CFPB commissioned a survey to explore how people perceive some of the changes brought about by the Act.

Our survey showed that:

  • 60% of cardholders find their monthly statements easier to read and understand
  • 60% feel that the terms on their credit card are clearer than they used to be
  • Among those who are at least somewhat familiar with the CARD Act, 57% believe the Act has been personally beneficial to them

In addition, 32% of people who noticed a change in their statements reported that they changed their behavior by increasing the amount of their monthly payment or by limiting their use of credit cards.

Another important insight is that there is still work to be done to enhance consumer understanding of their credit cards. For example, 80% of all cardholders who carry a balance from month to month are able to report their interest rate, but 35% of them are unable to say how much interest they paid. The survey also showed that consumers who know their rates or fees are more satisfied than those who do not know this information.

Part of the CFPB’s role is to make sure consumers have clear information on costs and risks so they can make the best decisions for themselves and their families. We are paying close attention to the level of consumer understanding.

One other thing we’re especially excited about is that this is the first survey the CFPB has ever commissioned, and we’ve made the raw results available to the public to download in CSV and TXT (tab delimited) formats. This detailed data is available on our Credit CARD Act page along with more information about the Credit CARD Act itself and additional infographics like the one above. I encourage you to take a look.

Learn more about our survey methodology.

Marla Blow is the CFPB Deputy Assistant Director for Card Markets.