This website presents data analyzed by a working group of the Advisory Committee to the NIH Director (ACD) chaired by Dr. Shirley Tilghman (Princeton) and Dr. Sally Rockey (NIH) (http://acd.od.nih.gov/bwf.htm). The working group was charged with examining the biomedical research workforce in the United States. The working group presented recommendations in a report to the ACD on June 14, 2012 (Biomedical Research WG Report ). The data on this site are intended as a supplement to that report.
The data are organized into two workforce frameworks – one for PhDs and one for MDs and MD-PhDs. The sources of all data are indicated.
Note that the various entities that collect data on the workforce have different definitions for areas of science and professions. In addition, due to these different definitions and various collection methods, different sources on the same topic may provide varying numbers. The frameworks represent the best effort to reconcile data from different sources.
Click for information about the origin of the figures.
Click for image maps with an estimate of the workforce numbers in each box.
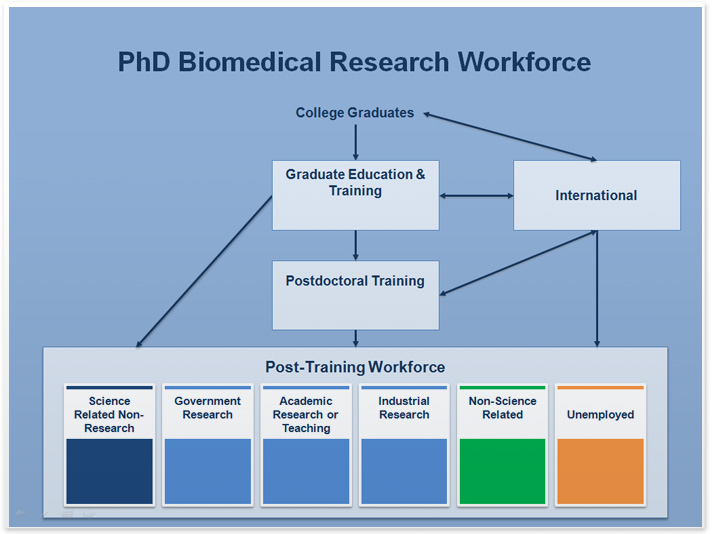 Conceptual Framework of the PhD Biomedical Research Workforce
Flow chart of the PhD biomedical research workforce from college graduates through graduate education and training, and postdoctoral training to the post-training workforce. The post-training workforce is divided into science-related non-research, government research, academic research or teaching, industrial research, non-science related, and unemployed. The flowchart includes inflow of international people. The chart depicts the numbers of trainees and number and percentage of people in each workforce box.
 Conceptual Framework of the MD and MD-PhD Workforce
Flow chart of the MD and MD-PhD biomedical research workforce from college graduates through medical and graduate education and training, postdoctoral training, residency, and research-based fellowships to the post-training workforce. The post-training workforce is divided into government research, academic research or teaching, industrial research, non-research non-clinical, non-research patient care, and unemployed. The flowchart includes inflow of international people. The chart depicts the numbers of trainees and number and percentage of people in each workforce box.
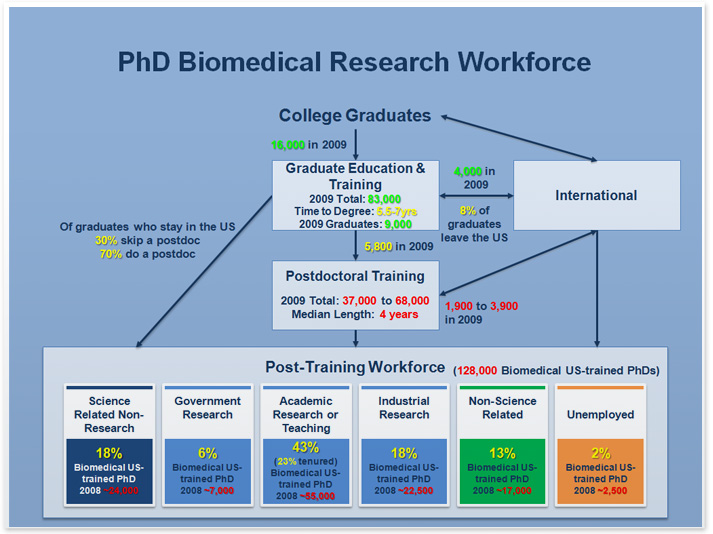
Confidence in data accuracy: high (green), medium (yellow), low (red); for more details see
colors
Conceptual Framework of the PhD Biomedical Research Workforce
Flow chart of the PhD biomedical research workforce from college graduates through graduate education and training, and postdoctoral training to the post-training workforce. The post-training workforce is divided into science-related non-research, government research, academic research or teaching, industrial research, non-science related, and unemployed. The flowchart includes inflow of international people. The chart depicts the numbers of trainees and number and percentage of people in each workforce box.

Confidence in data accuracy: high (green), medium (yellow), low (red); for more details see
colors
Conceptual Framework of the MD and MD-PhD Workforce
Flow chart of the MD and MD-PhD biomedical research workforce from college graduates through medical and graduate education and training, postdoctoral training, residency, and research-based fellowships to the post-training workforce. The post-training workforce is divided into government research, academic research or teaching, industrial research, non-research non-clinical, non-research patient care, and unemployed. The flowchart includes inflow of international people. The chart depicts the numbers of trainees and number and percentage of people in each workforce box.