The following data, generated by Dr. James Deatherage, are related to the message from the NIGMS Director in the November 15, 2006, issue of the NIGMS Feedback Loop. Additional charts and discussion of funding trends are also in this issue.
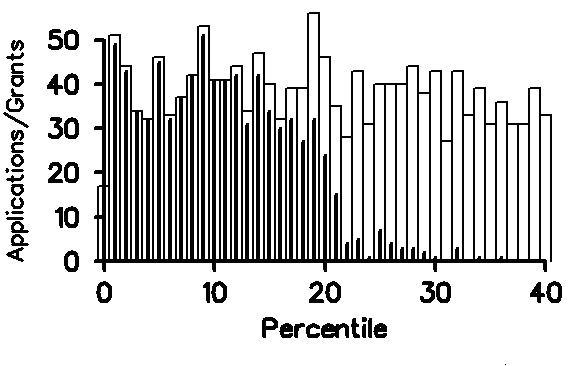
Figure 1. Fiscal Year 2006 GM R01 applications reviewed (white) and funded (black) are plotted against percentile. The graph counts all competing new and continuation (renewal) applications, including revisions.
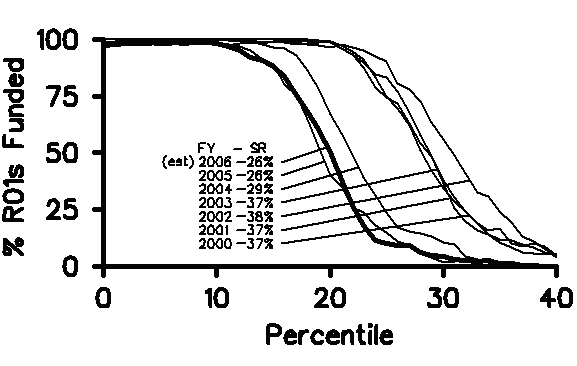
Figure 2. The percentage of R01 applications funded is plotted against percentile for Fiscal Years 2000-2006. Also shown are the corresponding published success rates for these years. Funding trends underlying the shift of these curves to lower percentiles after 2003 are shown in Figures 3, 4, and 5.
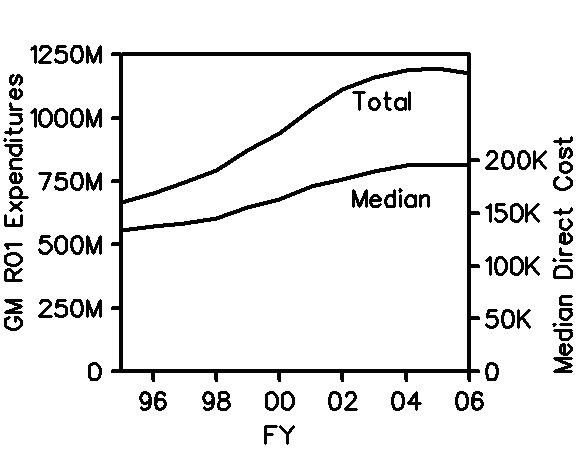
Figure 3. The upper curve shows total GM spending on R01s during Fiscal Years 1995-2006. The lower curve shows the median individual GM R01 direct cost budget. The GM appropriation and average R01 grant budget decreased in Fiscal Year 2006. This graph includes R37 Grants (MERIT Awards) and R29 grants (FIRST Awards, a now-discontinued award category).
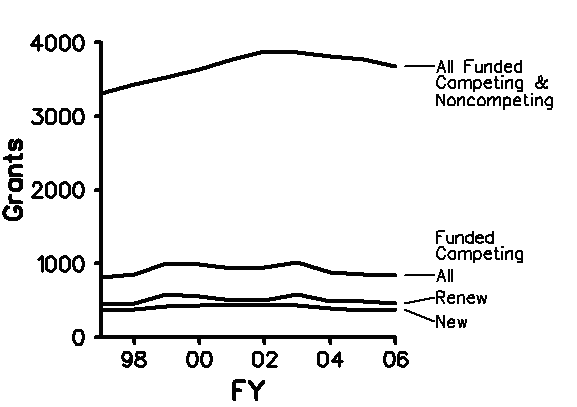
Figure 4. GM-funded R01 grants during Fiscal Years 1997-2006. This graph also includes R37 and R29 grants.
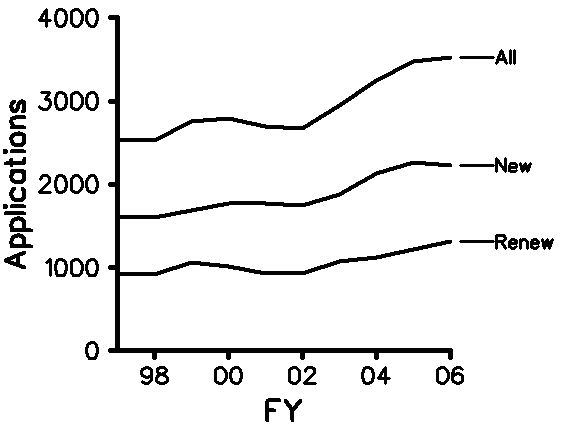
Figure 5. GM R01 applications in Fiscal Years 1997-2006. The increase in the number of proposals against a background of level agency budgets contributed significantly to the decrease in success rates in Fiscal Years 2004-2005 (see Figure 2). In Fiscal Year 2006, the number of applications and the success rate both leveled off. The applications prior to Fiscal Year 2003 include R29 applications.
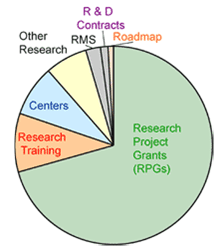
Figure 6. This figure shows the distribution of NIGMS spending on research and training.
More than 70% of the budget is devoted to research project grants (RPGs). Within the RPG pool, approximately 86% of the budget supports R01 grants (including MERIT awards), 1.1% supports R21 grants, 0.7% supports R15 (AREA) grants, 4.5% supports P01 (program project) grants, 3.2% supports Small Business Innovation Research/Small Business Technology Transfer (SBIR/STTR) grants, and 1.7% supports U01 (cooperative agreement) grants associated with the Pharmacogenetics Research Network and the Models of Infectious Disease Agent Study (MIDAS).
About 10% of the budget is devoted to research training. Within this category, 86% of the funds support institutional training grants while 14% support individual fellowships.
Centers make up 8% of the budget. Most of these centers are associated with initiatives such as the Protein Structure Initiative, the Large-Scale Collaborative Award (glue grant) program, the NIGMS National Centers for Systems Biology program, the Chemical Methodologies and Library Development program, centers for basic research on human embryonic stem cells, and centers devoted to specific studies of trauma, burn, peri-operative injury, and wound healing.
Other research makes up 7% of the budget. The Minority Biomedical Research Support (MBRS) program accounts for 76% of this category. Research career awards represent another significant component.
The remaining categories include research management and support, or RMS, which supports administrative costs, such as NIGMS staff salaries and scientific review expenses (2.4% of the budget); research and development contracts, which support activities such as the NIGMS Human Genetic Cell Repository (1.2%); the NIGMS contribution to the NIH Roadmap for Medical Research (0.9%); and Intramural Research (<0.1%).
The distribution of funds across these mechanisms has been stable since Fiscal Year 2003.
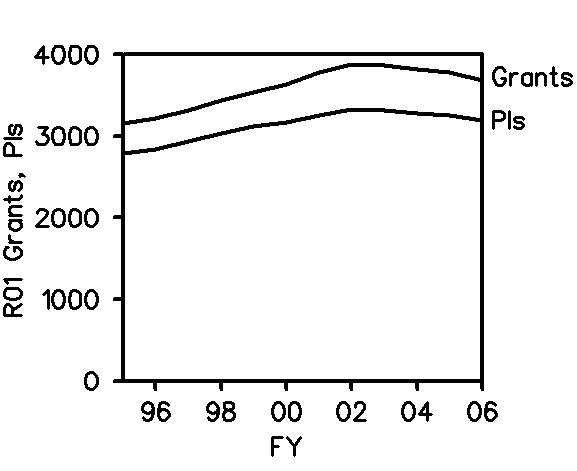
Figure 7. The lower curve shows the number of GM-supported R01 PIs. The upper curve shows the number of funded R01s, both competing and noncompeting. This graph also includes R37 and R29 grants and PIs.
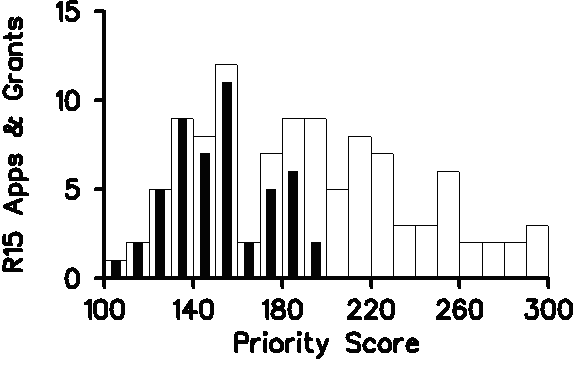
Figure 8. The number of GM AREA (R15) applications reviewed (white) and funded (black) in Fiscal Year 2006 is plotted against priority score.
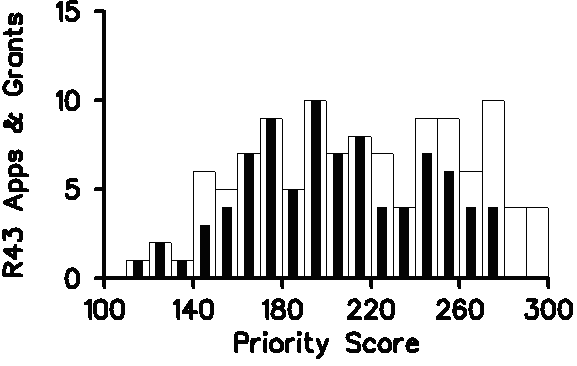
Figure 9. The number of GM SBIR Phase I (R43) applications reviewed (white) and funded (black) in Fiscal Year 2006 is plotted against priority score.

Figure 10. The number of GM NRSA F32 Fellowship applications reviewed (white) and funded (black) in Fiscal Year 2006 is plotted against priority score. Some offers made by NIGMS to successful F32 applicants were declined.