America's Children in Brief: Key National Indicators of Well-Being, 2012
Population Figures
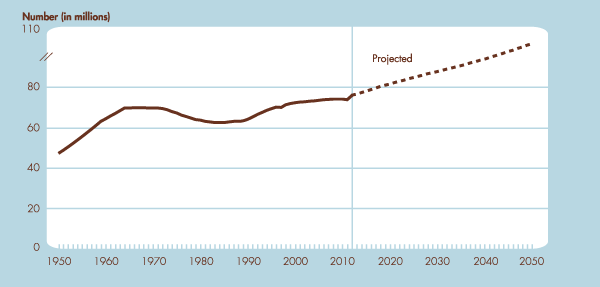
Indicator POP1: Number of children ages 0–17 in the United States, 1950–2011 and projected 2012–2050

NOTE: Population projections are based on Census 2000 and may not be consistent with the 2010 Census results. Projections based on the 2010 Census are scheduled for release in late 2012.
SOURCE: U.S. Census Bureau, Decennial Censuses and Population Estimates and Projections.
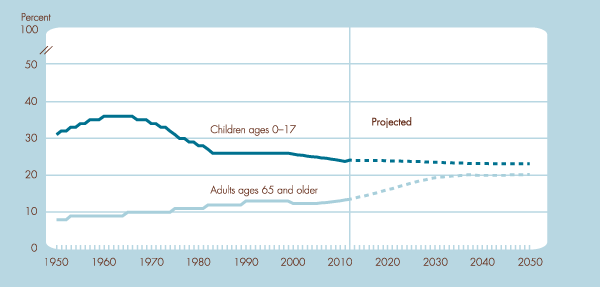
Indicator POP2: Children ages 0–17 and adults ages 65 and older as a percentage of the U.S. population, 1950–2011 and projected 2012–2050

NOTE: The Population projections are based on Census 2000 and may not be consistent with the 2010 Census results. Projections based on the 2010 Census are scheduled for release in late 2012.
SOURCE: U.S. Census Bureau, Decennial Censuses and Population Estimates and Projections.
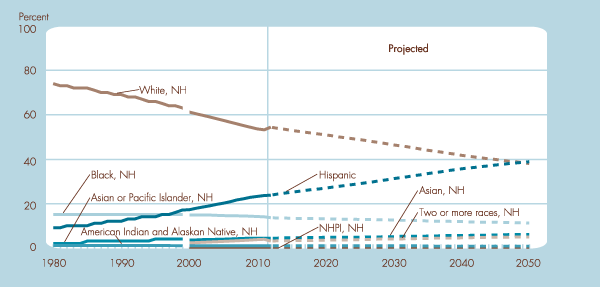
Indicator POP3.A: Percentage of children ages 0–17 in the United States by race and Hispanic origin, 1980–2011 and projected 2012–2050

NOTE: The acronym NH refers to non-Hispanic origin. The acronym NHPI refers to the Native Hawaiian and Other Pacific Islander population. Each group represents the non-Hispanic population, with the exception of the Hispanic category itself. Race data from 2000 onward are not directly comparable with data from earlier years. Data on race and Hispanic origin are collected separately. Persons of Hispanic origin may be of any race. Population projections are based on Census 2000 and may not be consistent with the 2010 Census results.
SOURCE: U.S. Census Bureau, Population Estimates and Projections.
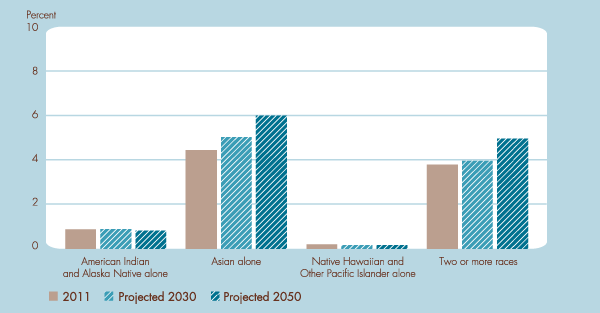
Indicator POP3.B: Race groups constituting less than 10 percent of the population ages 0–17 in the United States: 2011 and projected 2030 and 2050

NOTE: Each group shown represents the non-Hispanic population. Data for 2030 and 2050 are derived from the national population projections released in August 2008. The population projections are based on Census 2000 and may not be consistent with the 2010 Census results.
SOURCE: U.S. Census Bureau, Population Estimates and Projections.

