Contact Us
- 800–CDC–INFO
- (800-232-4636)
- 888–232–6348 (TTY)
- cdcinfo@cdc.gov
2005-06 U.S. INFLUENZA SEASON SUMMARY*
NOTE: This document is provided for historical purposes only and may not reflect the most accurate and up-to-date information on this subject. For current flu information, please visit the CDC Flu Homepage.
Synopsis:
During the 2005-06 season, influenza A (H3N2) viruses predominated overall, but late in the season influenza B viruses were more frequently isolated than influenza A viruses. Influenza A (H1N1) viruses circulated at low levels throughout the season. Nationally, activity was low from October through early January, increased during February, and peaked in early March. Peak activity was less intense, but activity remained elevated for a longer period of time this season compared to the previous three seasons. The longer period of elevated activity may be due in part to regional differences in the timing of peak activity and intensity of influenza B activity later in the season.
No human infections with avian influenza A(H5N1) have been identified in the U.S. However, during the 2005-06 season, outbreaks of avian influenza A (H5N1) among poultry and isolated human cases were reported from countries in Africa, Europe, and Asia. Due to the expanding epizootic of H5N1, the Centers for Disease Control and Prevention (CDC) continues to recommend enhanced surveillance for human infection with avian influenza among travelers returning to the United States from H5N1- affected countries. On June 13, 2006, updated recommendations for enhanced surveillance were issued and can be found on the CDC Web site at: http://www2a.cdc.gov/han/ArchiveSys/ViewMsgV.asp?AlertNum=00246.
Laboratory Surveillance*:
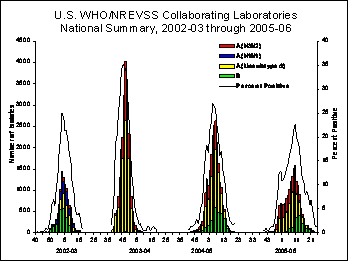
From October 2, 2005, through June 24, 2006, World Health Organization (WHO) and National Respiratory and Enteric Virus Surveillance System (NREVSS) laboratories tested 148,636 specimens for influenza viruses, of which 17,977 (12.1%) were positive. Of these, 14,335 (79.7%) were influenza A viruses, and 3,642 (20.3%) were influenza B viruses. Among the influenza A viruses, 5,740 (40.0%) have been subtyped; 5,277 (91.9%) were influenza A (H3N2) viruses and 463 (8.1%) were influenza A (H1N1) viruses. Nationally, influenza A viruses predominated overall, but since the middle of April, influenza B viruses were more frequently isolated than influenza A viruses. Influenza B activity was most prevalent in the western part of the country (West North Central, West South Central, and Mountain regions) where it occurred earlier and accounted for more than 25% of isolates identified in these regions.
Nationwide, the percentage of respiratory specimens testing positive for influenza viruses peaked at 22.7% during the week ending March 11, 2006 (week 10) and activity remained elevated (more than 10% of specimens tested were positive for influenza) for 18 weeks. During the previous 3 seasons (2002-03, 2003-04, and 2004-05), the peak percentage of specimens testing positive for influenza viruses ranged from 26% to 41% and the period of elevated activity ranged from 11 to 15 weeks.
View Full Screen | View Chart Data
The timing of peak activity varied across surveillance regions. The western-most regions (Pacific, Mountain, and West South Central) reported an early and extended period of activity which was due to an early peak of influenza A activity during mid-December through January and a second, lesser peak of influenza B activity from early March to early May. In the middle and eastern regions (East South Central, South Atlantic, West North Central, East North Central, Mid-Atlantic, and New England), influenza A activity peaked later and influenza B activity occurred to a lesser extent than was seen in the western U.S. As a result, these regions saw a single peak of influenza virus activity in early March.
Antigenic Characterization§:
CDC has antigenically characterized 1,019 influenza viruses [563 influenza A(H3N2), 135 influenza A(H1N1), and 321 influenza B viruses] collected by U.S. laboratories since October 1, 2005.
Of the 563 influenza A (H3N2) viruses, 410 (72.8%) were characterized as A/California/07/2004-like, which is the influenza A (H3N2) component recommended for the 2005-06 influenza vaccine, and 153 (27.2%) viruses showed reduced titers with antisera produced against A/California/07/2004. Of the 153 low-reacting viruses, 127 were tested with antisera produced against A/Wisconsin/67/2005 (the H3N2 component selected for the 2006-07 vaccine), and 94 are A/Wisconsin-like.
The hemagglutinin proteins of 131 (97.0%) of the 135 characterized influenza A (H1N1) viruses were antigenically similar to the hemagglutinin of the vaccine strain A/New Caledonia/20/99, and the other 4 (3.0%) showed reduced titers with antisera produced against A/New Caledonia/20/99.
Sixty (18.7%) of the 321 influenza B viruses that have been characterized belong to the B/Yamagata lineage: 10 were similar to B/Shanghai/361/2002, the recommended influenza B component for the 2005-06 influenza vaccine, 49 were characterized as B/Florida/07/2004-like, and 1 showed reduced titers with antisera produced against both B/Shanghai/361/2002 and B/Florida/07/2004. B/Florida/07/2004 is a minor antigenic variant of B/Shanghai/361/2002. Two hundred sixty-one (81.3%) of the 321 influenza B viruses were identified as belonging to the B/Victoria lineage: 260 were similar to B/Ohio/1/2005, the influenza B component selected for the 2006-07 vaccine, and 1 showed reduced titers with antisera produced against B/Ohio/1/2005.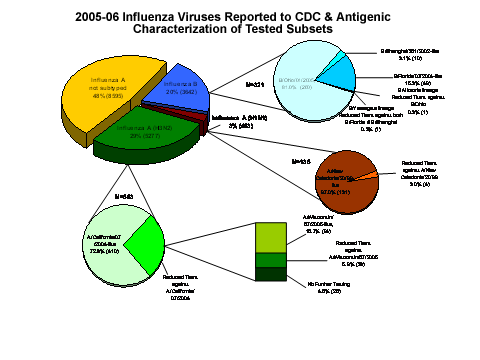
COMPOSITION OF THE 2006-07 INFLUENZA VACCINE:
The Food and Drug Administration's Vaccines and Related Biological Products Advisory Committee has recommended that the 2006-07 trivalent influenza vaccine for the United States contain A/New Caledonia/20/99-like (H1N1), A/Wisconsin/67/2005-like (H3N2), and B/Malaysia/2506/2004-like viruses. This represents a change in the influenza A (H3N2) and influenza B viruses compared to those included in the 2005-06 vaccine. A/Wisconsin/67/2005 is an antigenic variant of the 2005-06 vaccine strain A/California/07/2004. Influenza B viruses currently circulating can be divided into two antigenically distinct lineages represented by B/Yamagata/16/88 and B/Victoria/2/87 viruses. The updating of the influenza B component to B/Ohio/1/2005 (which is antigenically equivalent to B/Malaysia/2506/2004) represents a change to the B/Victoria lineage. These recommendations were based on antigenic analyses of recently isolated influenza viruses, epidemiologic data, and post-vaccination serologic studies in humans.
Pneumonia and Influenza (P&I) Mortality Surveillance*:
The proportion of deaths in the United States attributed to pneumonia and influenza (P&I) as reported by the 122 Cities Mortality Reporting System peaked twice at 7.8%, once during the week ending January 14, 2006 (week 2), and again during the week ending March 18, 2006 (week 11), but did not exceed the epidemic threshold¶. During the previous 3 influenza seasons, the peak percentage of P&I deaths ranged from 8.5% to 10.4% and the total number of weeks above epidemic threshold ranged from 4 to 10.

INFLUENZA-RELATED PEDIATRIC MORTALITY*:
During October 2, 2005 through June 24, 2006, 41 pediatric deaths have been reported to CDC from 14 states (Arizona, California, Colorado, Connecticut, Kansas, Michigan, New Jersey, New Mexico, Oklahoma, Pennsylvania, Rhode Island, Vermont, Virginia, and Wyoming) and New York City. Four of the deaths reported during this time period occurred prior to the 2005-06 influenza season. Influenza-associated pediatric mortality was first made a nationally notifiable condition for the 2004-05 influenza season. Due to the length of time this system has been in place, and because state participation may vary, it is not feasible to compare the number of deaths from season-to-season.
Influenza-Associated Pediatric Hospitalizations:
Laboratory-confirmed influenza-associated pediatric hospitalizations are monitored in two population-based surveillance networks‡: Emerging Infections Program (EIP) and New Vaccine Surveillance Network
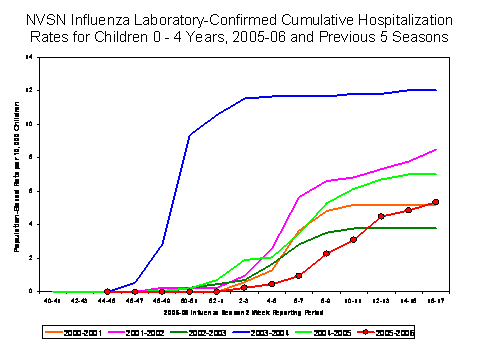
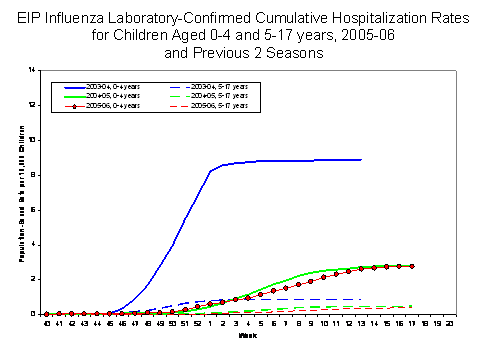
(NVSN)††. During October 1, 2005 – April 30, 2006, the preliminary influenza-associated hospitalization rate reported by EIP for children aged 0-17 years was 1.3 per 10,000. For children aged 0-4 years and 5-17 years, the rate was 3.1 per 10,000 and 0.4 per 10,000, respectively. During October 30, 2005 – April 29, 2006, the preliminary laboratory-confirmed influenza-associated hospitalization rate for children aged 0-4 years in NVSN was 5.4 per 10,000. Rate estimates are preliminary and may continue to change as data are finalized.
During the 2004-05 and 2003-04 seasons, the end-of-season hospitalization rate for EIP ranged from 3.3 to 8.9 per 10,000 children aged 0-4 years and 0.6 to 0.8 per 10,000 for children aged 5-17 years. During years 2000–2005, the end-of-season hospitalization rate for NVSN ranged from 3.7 (2002-03) to 12 (2003-04) per 10,000 children aged 0-4 years. Differences in rate estimates between the EIP and the NVSN systems are likely due to the different case-finding methods and the different populations monitored.
INFLUENZA-LIKE ILLNESS (ILI) SURVEILLANCE:
Nationally, the percentage of outpatient visits for ILI reported by U.S. sentinel providers peaked twice, once at 3.3% during the week ending December 31, 2005 (week 52), and again at 3.2% during the week ending March 4, 2006 (week 9), and exceeded baseline levels (2.2%)§§ for 16 consecutive weeks. During the previous 3 influenza seasons, the peak percentage of patient visits for ILI ranged from 2.3% to 7.6% and exceeded baseline levels for 6-14 consecutive weeks.
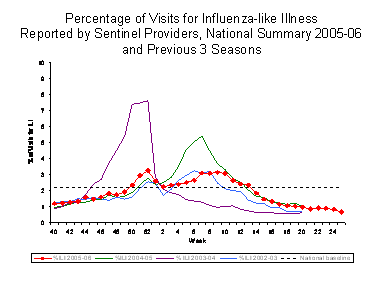
View Full Screen | View Chart Data
Regional variations in timing of peak ILI activity mirrored what was seen in the virologic data: earlier (mid to late December) in the western regions and later (February) in the middle and eastern regions. The peak percentage of patient visits for ILI in the nine regions ranged from 2.2% to 7.0%. However, due to differences in regional baselines, it is not possible to make direct comparisons of intensity of influenza activity based on these data.
| View Full Screen Or click on each region graphic, to view larger images |

|
Influenza Activity as Assessed by State and Territorial Epidemiologists:
On the basis of data from state and territorial epidemiologist reports, influenza activity¶¶ nationwide peaked during the week ending March 11, 2006 (week 10) when 25 states reported widespread influenza activity and 16 reported regional influenza activity. The peak number of states reporting widespread or regional activity during the previous 3 seasons ranged from 35 to 50. The peak number of states in the western-most regions reporting widespread or regional activity occurred in early January whereas the peak in the mid and eastern U.S. occurred in early and mid March, respectively. Widespread activity was reported by one or more states for 18 consecutive weeks from the week ending December 17, 2005 (week 50) through the week ending April 15 (week 15). Thirty-eight states and New York City reported widespread activity at least once during the season.
--------------------------------------------------------------------------------
Report prepared: July 21, 2006

