
U.S. DEPARTMENT OF HEALTH AND HUMAN SERVICES
Improving the understanding, detection, and management of kidney disease.

Learn about the two recommended tests for kidney disease.
Learn More
Learn about diet and lifestyle changes to help you live a healthier and longer life.
Learn MoreNKDEP offers educational materials to people at risk for and diagnosed with kidney disease, and the providers who treat them. Select materials are listed below. For more resources and informationon how to order or download, visit our Resources Page.

All of the information on this site is in the public domain and all documents can be downloaded and reproduced at no charge. However, if you choose to use our materials, we would appreciate it if you would include the following reference: Information provided by the National Kidney Disease Education Program (NKDEP), a program of the National Institutes of Health. For more information, contact NKDEP at 1-866-4-KIDNEY or visit www.nkdep.nih.gov.
If you are interested in co-branding and/or tailoring any of our materials, please contact us.
Some of the images that were created by NKDEP can also be downloaded and used in other materials at no charge. These images are located below with accompanying captions that you are welcome to use in your materials, newsletters, and other communications.
We do ask that you credit each illustration downloaded as follows:
National Kidney Disease Education Program, National Institutes of Health.
For more images, visit the NIDDK image library.
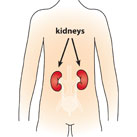
An illustration of a child's body with arrows pointing to two kidneys located near the center of the back
Download
(.jpg/113 K)
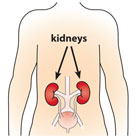
An illustration of the human body with arrows pointing to two kidneys located near the center of the back
Download
(.jpg/49 K)
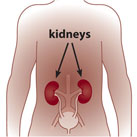
An illustration of an African-American human body with arrows pointing to two kidneys located near the center of the back
Download
(.jpg/57 K)
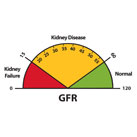
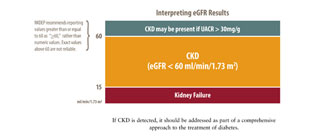
A graphic of a speedometer-like dial that depicts GFR results of 0 to 15 as kidney failure, 15 to 60 as kidney disease, and 60 to 120 as normal.
Download
(.jpg/105 K)
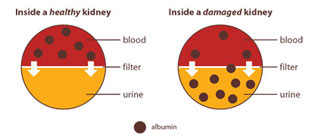
A diagram illustrating a healthy kidney with albumin only found in blood, and a damaged kidney that has albumin in both blood and urine
Download
(.jpg/150 K)
For more statistics on CKD, read the Centers for Disease Control and Prevention's (CDC) fact sheet on CKD.

PDF files require Adobe Acrobat
Page last updated: March 1, 2012
NKDEP is an initiative of the National Institute of Diabetes and Digestive and Kidney Diseases (NIDDK), National Institutes of Health (NIH), U.S. Department of Health & Human Services (HHS)
NIH...Turning Discovery Into Health®


