


www.nnvl.noaa.gov
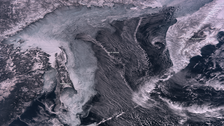
 A drop in the jet stream sent temperatures across the United States plummeting over the Martin Luther King Jr Holiday weekend. The pronounced change in temperatures can be seen in this weather data from NOAA/NCEP's Real-Time Mesoscale Analysis. Areas colored blue are below freezing. The diurnal cycle of heating and cooling can be seen over time, but the pattern is clear: much of the U.S. is pretty cold.
Drought Sweeps Nation: Part II
January 3, 2013
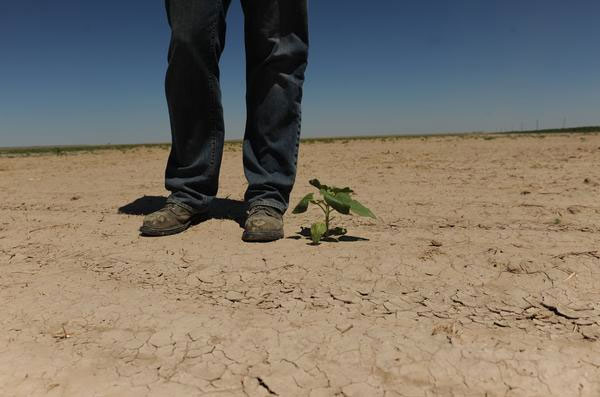
Based on the Palmer Drought Index, as reported in the State of the Climate Report, June 2012, severe to extreme drought affected about 33 percent of the contiguous U.S. by the end of June. This was an increase of about 10 percent from the previous month. Dry conditions led to dry vegetation, parching key commodity crops, including corn, wheat, and soybeans and fueled fires. This dry weather contributed to several large wildfires breaking out during the month (15th, 20th, 25th, and 26th) in the northern and central sections of the state.
Moving forward in July, the drought still showed no signs of lifting its grip over Midwestern states and was another warmer-and-drier-than-average month when weather conditions are averaged across the country. It was the warmest and 28th driest July on record.
The drought seemed to propel fireworks the day after the 4th of July with 45 wildfires soaring temperatures and bellowing smoke across many parts of the U.S. These large fires displaced tens of thousands of people, destroyed homes and businesses. Drought conditions were measured in many agricultural indicators; 48 percent of the nation's corn crop was rated in poor to very poor condition. This is more than the 22 percent at the end of June.
By the end of August, severe to extreme drought was still affecting about 39 percent of the contiguous U.S. This was an increase of 2 percent from the last month. About 55 percent of the contiguous U.S. fell in the moderate to extreme drought categories.
During November 2012, the average temperature for the contiguous U.S. was 44.1°F, 2.1°F above the 20th century average tying with 2004 as the 20th warmest November on record. Last November also marked the dryness month, which characterized much of the year, ranking as the eighth driest November since 1895. (For more, see http://go.usa.gov/g6bY)
Satellite-based Drought Indicators
Governments and managers rely on objective and unbiased scientific information about trends in streamflow, precipitation and other factors that contribute to drought. This data help them to mitigate the impacts of drought and help them to understand where drought is occurring, how long it may impact an area and where it will strike next. The most accurate assessment of drought and climatic conditions can be made by taking measurements of the climatic conditions where the climate is happening, on the ground or in the atmosphere. These are called "in situ" observations. Satellites supplement "in situ" data by providing consistent observations at high spatial density with global coverage.
There are two commonly-used satellite-based drought indicators that supply data: Vegetation Health Index (VHI) and Vegetation Drought Response Index (VegDRI). The VHI is a NOAA product that contains several indices derived from polar-orbiting NOAA satellites. The VegDRI product is produced by the National Drought Mitigation Center (NDMC) in collaboration with several other partners. It is a national map covering the contiguous U.S., produced every two weeks; it provides regional to sub-county scale information about drought's effects on vegetation.
More to Ponder
On a positive note, it's encouraging to know that NOAA's U.S. Drought Monitor tracks current and historic drought conditions, and that every month the National Weather Service produces a Drought Outlook, with bi-weekly updates. In addition, satellite images have played a major role in detecting drought in regional studies from various areas in this country as well as parts of the world. These satellite observations contribute significantly to disaster response planning by supporting decisions that save lives and that lessen the impact of drought. Historic satellite images also help create drought statistics that aid farmers and the government in making more meaningful decisions for drought disaster management. Advances in climate monitoring and forecasting can help drought laden communities and areas reduce the impact of these natural hazards. Satellites play a crucial role in this effort as they enable scientists to track climate conditions over data-sparse land and ocean areas.
Related Article(s):
Drought Sweeps Nation: Part I
----