
 Short URL »
Consumer Broadband Test vs Advertised or Typical Data as of: 06/30/12
...
ADVERTISED
TYPICAL
SPEEDTEST
SPEEDTEST VS ADVERTISED
SPEEDTEST VS TYPICAL
DOWNLOAD
UPLOAD
< 200 kbps.
> 200 kbps.
< 768 kbps.
> 768 kbps.
< 1.5 mbps.
> 1.5 mbps.
< 3 mbps.
> 3 mbps.
< 6 mbps.
> 6 mbps.
< 10 mbps.
> 10 mbps.
< 25 mbps.
> 25 mbps.
< 50 mbps.
> 50 mbps.
< 100 mbps.
> 100 mbps.
< 1 gbps.
> 1 gbps.
typical faster
typical slower
Description:
-
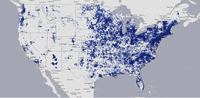 Maximum Advertised Speed Available
This map displays broadband availability by maximum advertised speed tier. The default view shows advertised download speeds of ≥ 3 Mbps.
Maximum Advertised Speed Available
This map displays broadband availability by maximum advertised speed tier. The default view shows advertised download speeds of ≥ 3 Mbps.
-
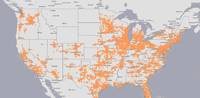
 Type of Technology Available
This map displays broadband technologies offered to end users (e.g. DSL, cable, wireless, fiber, etc.).
Type of Technology Available
This map displays broadband technologies offered to end users (e.g. DSL, cable, wireless, fiber, etc.).
-
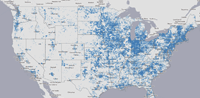
 Number of Broadband Providers
This map displays the number of different broadband providers offering service across the country, as well as the areas unserved by any provider.
Number of Broadband Providers
This map displays the number of different broadband providers offering service across the country, as well as the areas unserved by any provider.
-
 Broadband Provider Service Area
This tool will display the service area of a specific broadband provider, as well as the maximum advertised speeds and type of technologies deployed, based on the available data.
Broadband Provider Service Area
This tool will display the service area of a specific broadband provider, as well as the maximum advertised speeds and type of technologies deployed, based on the available data.
-
 Broadband Availability Across Demographic Characteristics
This map displays availability of higher broadband speeds across demographic characteristics (density, age, income or education).
Broadband Availability Across Demographic Characteristics
This map displays availability of higher broadband speeds across demographic characteristics (density, age, income or education).
-
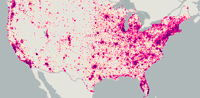 Consumer Broadband Test vs Advertised or Typical
This map displays the results of the FCC's Consumer Broadband Test and allows comparison against advertised speeds or reported typical speeds.
Consumer Broadband Test vs Advertised or Typical
This map displays the results of the FCC's Consumer Broadband Test and allows comparison against advertised speeds or reported typical speeds.
-
 Community Anchor Institutions
A searchable map that will display the 25 closest Community Anchor Institutions to the search address entered.
Community Anchor Institutions
A searchable map that will display the 25 closest Community Anchor Institutions to the search address entered.
-
 NBM User Feedback
This map displays crowdsourced feedback generated by users of the NBM. It updates with each response users provide on the search page.
NBM User Feedback
This map displays crowdsourced feedback generated by users of the NBM. It updates with each response users provide on the search page.
You are automatically leaving the National Broadband Map site press escape key to cancel
You're leaving the National Broadband Map Website
You are now leaving the National Broadband Map web site, and will be automatically forwarded to the following site:
%url%
This link is provided for informational purposes only. We do not endorse any other product or service, and are not responsible for the content of other websites, including their accuracy, completeness, or timeliness.