


Maryland |
The Maryland State Department of Education (MSDE) is implementing several programs that are designed to help its schools ensure they are safe and supportive, thereby improving student outcomes. Below are descriptions of two such programs.
Safe and Supportive Schools
With a U.S. Department of Education's Office of Safe and Healthy Students Safe and Supportive Schools grant, MSED is developing and administering a statewide measurement system to assess school safety, student engagement, and school environment, as reported by students, parents, and school staff. The project is a collaboration between the Maryland State Department of Education, Sheppard Pratt Health System, and Johns Hopkins University. The project will be implemented in 60 persistently low-achieving high schools in participating school districts. The project seeks to achieve (1) a sustainable statewide system for assessing school safety, school engagement, and school environment, as reported by students, parents, and staff; (2) the implementation of a continuum of programs to meet the needs of students; (3) a sustainable model for statewide safety assessment and implementation of programs that include communities, school districts, and state partnerships; and (4) reduced rates of school violence and substance use and improvements in student engagement and school environment to support learning.
Race to the Top
MSDE is a recipient of the U.S. Department of Education's Race to the Top funds and has a complete plan for upgrading and improving capacity at the State level. It is their intention to coordinate their efforts with the Division of Assessment and Accountability as they implement RTT to ensure that any capacity needs necessary to sustain the collection of the climate survey data are also addressed. Maryland is also building upon previous work funded through grants from the Centers for Disease Control and Prevention to develop web-based survey systems related to bullying.
Maryland currently collects Youth Risk Behavior Surveillance System (YRBSS) data every other year. Schools utilize a number of separate data systems to track discipline referrals, academic indicators, school safety indicators, and program implementation data. Most of the MAryland State Department of Education’s LEAs collect school climate and school safety data at this time. Information on school achievement, attendance, demographics and other information for state, system, and school building data is reported annually through Maryland Report Card (www.mdreportcard.org).
On a biannual basis, Maryland collects data on priority health-risk behaviors and the prevalence of obesity and asthma among youth and young adults as part of the Youth Risk Behavior Surveillance System (YRBSS). Below is data for a selection of YRBSS indicators for Maryland and the United States.

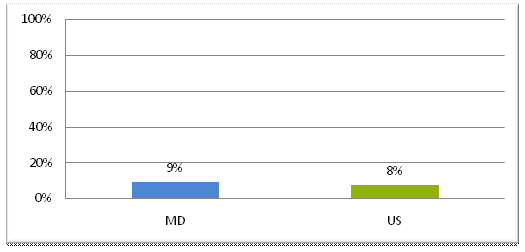
Indicator 1: Percent of Students Who Reported That They Had Been Threatened or Injured with a Weapon on School Property One Or More Times (for example, a gun, knife, or club during the 12 months before the survey)(2009)
View Larger
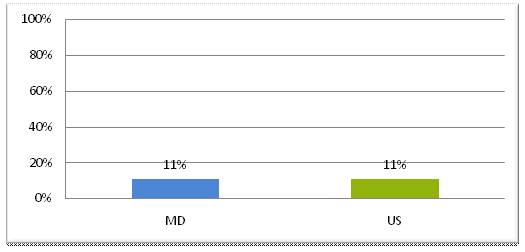
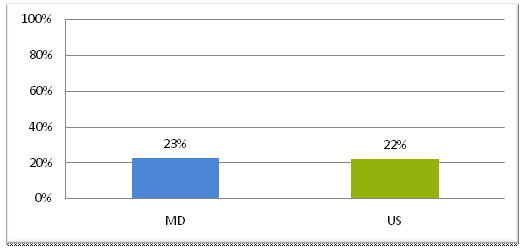
Indicator 2: Percentage of Students in Grades 9-12 Who Reported Having Been in a Physical Fight On School Property At Least One Time During the Previous 12 Months (2009)
View Larger
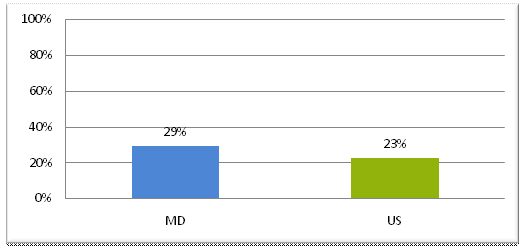
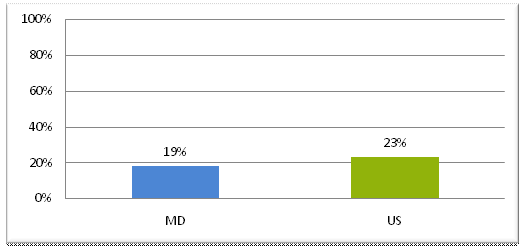
Indicator 3: Percentage of High School Students Who Reported That They Were Offered, Sold, Or Given An Illegal Drug By Someone On School Property (2009)
View Larger
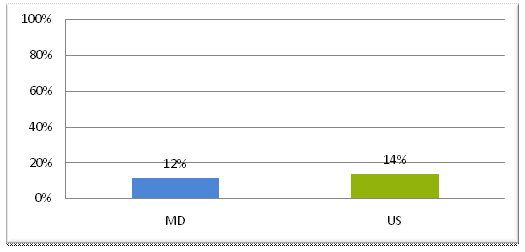
Indicator 4: Percentage of High School Students Who Reported That They Seriously Considered Attempting Suicide (2009)
View Larger
Indicator 5: Percentage of High School Students Who Reported That They Have Not Participated In At Least 60 Minutes of Physical Activity On Any Day (2009)
View Larger
Indicator 6: Percentage of High School Students Who Reported That They Ate Fruits And Vegetables Five Or More Times Per Day (2007)
View Larger
Indicator 1: Percent of Students Who Reported That They Had Been Threatened or Injured with a Weapon on School Property One Or More Times (for example, a gun, knife, or club during the 12 months before the survey) (2009)
Centers for Disease Control and Prevention. Youth Risk Behavior Surveillance-United States, 2009. Surveillance Summaries, June 4, 2010. MMWR 2010;59(No. SS-5).
NOTE: 95% confidence interval
Indicator 2: Percentage of Students in Grades 9-12 Who Reported Having Been in a Physical Fight On School Property At Least One Time During the Previous 12 Months (2009)
Robers, S., Zhang, J., and Truman, J. (2010). Indicators of School Crime and Safety: 2010 (NCES 2011-002/NCJ 230812). National Center for Education.
Indicator 3: Percentage of High School Students Who Reported That They Were Offered, Sold, Or Given An Illegal Drug By Someone On School Property (2009)
Centers for Disease Control and Prevention. Youth Risk Behavior Surveillance-United States, 2009. Surveillance Summaries, June 4, 2010. MMWR 2010;59(No. SS-5).
NOTE: 95% confidence interval
Indicator 4: Percentage of High School Students Who Reported That They Seriously Considered Attempting Suicide (2009)
Centers for Disease Control and Prevention. Youth Risk Behavior Surveillance�United States, 2009. Surveillance Summaries, June 4, 2010. MMWR 2010;59(No. SS-5).
NOTE: 95% confidence interval
Indicator 5: Percentage of High School Students Who Reported That They Have Not Participated In At Least 60 Minutes of Physical Activity On Any Day (2009)
Centers for Disease Control and Prevention. Youth Risk Behavior Surveillance-United States, 2009. Surveillance Summaries, June 4, 2010. MMWR 2010;59(No. SS-5).MMWR
NOTE: 95% confidence interval
Indicator 6: Percentage of High School Students Who Reported That They Ate Fruits And Vegetables Five Or More Times Per Day (2007)
Centers for Disease Control and Prevention. Youth Risk Behavior Surveillance-United States, 2007. Surveillance Summaries, June 6, 2008. MMWR
NOTE: 95% confidence interval
Upcoming Events
Supportive School Discipline Webinar Series: Addressing Truancy-- Innovative Approaches to Systemically Increasing Attendance and Reducing Chronic Truancy
February 27, 4:00-5:30 pm ET
Research
HHS/Office of Adolescent Health Updates State-by-State Adolescent Mental Health Facts. The Department of Health and Human Services Office of Adolescent Health has recently updated its state summaries that focus on adolescent mental health. Each state page reports on positive social skills, depressive symptoms, depressive episodes and suicidal thoughts, attempts, and injuries. Learn More


