NextGen
Airport Performance — Hartsfield - Jackson Atlanta International
Hartsfield-Jackson Atlanta International Airport (ATL) has been the busiest US airport for many years, based on passenger traffic and the number of landings and take-offs. The airport is the primary hub for Delta Air Lines and Delta Connection partner ExpressJet; the Delta hub in Atlanta is the world's largest. Several NextGen capabilities and enabling technologies have been implemented since 2009, including Airport Surface Detection Equipment - Model X (ASDE-X), Performance Based Navigation (PBN) Procedures and Airspace Redesign, Basic Rerouting and Adjacent Center Metering.
All the results reported are in Calendar Year (CY) or Fiscal Year (FY).
| Performance Indicator (FY) |
Average Gate Arrival Delay
Minutes per Flight
During Core Hours (7:00 – 21:59 local), the yearly average of the difference between the Actual Gate-In Time and the Scheduled Gate-In time for flights between the selected airport and any of the Aviation System Performance Metrics airports. The delay for each fiscal year is calculated based on the 0.5 - 99.5 percentile of the distributions for the year. Flights may depart outside Core Hours, but must arrive during them. |
9.6 |
4.9 |
4.3 |
-0.3 |
Average Gate to Gate Time
Minutes per Flight
During Core Hours (7:00 – 21:59 local), the yearly average of the difference between the Actual Gate-In time at the selected airport and the Actual Gate-Out time at the origin (any Aviation System Performance Metrics airport). Flights may depart outside Core Hours, but must arrive during them. |
117.7 |
116.6 |
115.0 |
112.8 |
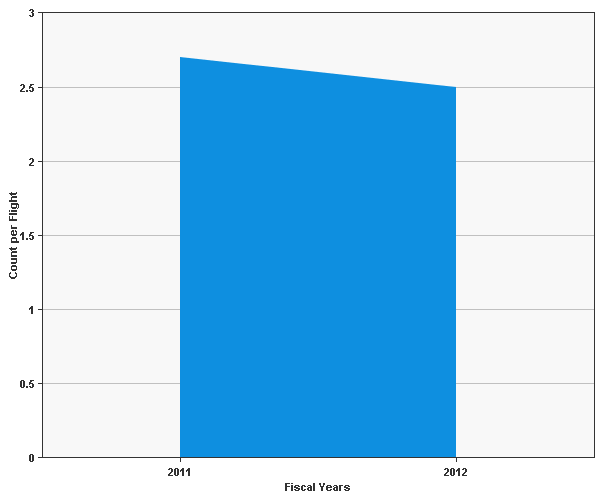
Average Number of Level-offs Per Flight
Count per Flight
The count of instances when an arriving aircraft will maintain a single altitude during their descent to an airport averaged for the fiscal year. |
|
|
2.7 |
2.5 |
Distance in Level Flight from Top of Descent to Runway Threshold
Nautical Miles per Flight
The distance flown while maintaining a level altitude from when an aircraft begins its descent until it reaches the runway threshold, averaged for the fiscal year. |
|
|
38.4 |
37.0 |
Taxi-In Time
Minutes per Flight
During Core Hours (7:00 – 21:59 local), the yearly average of the difference between Wheels-On time and Gate-In time for flights between the selected airport and any of the Aviation System Performance Metrics airports. Flights may depart outside Core Hours, but must arrive during them. |
11.4 |
11.7 |
11.1 |
10.3 |
Taxi-Out Time
Minutes per Flight
During Core Hours (7:00 – 21:59 local), the yearly average of the difference between Gate-Out time and Wheels-Off time for flights between the selected airport and any of the Aviation System Performance Metrics airports. Flights must depart during Core Hours, but may arrive outside them. |
22.5 |
22.1 |
21.5 |
20.0 |
High Low
Efficiency addresses the operational and economic cost-effectiveness of gate-to-gate flight operations from a single-flight perspective. In all phases of flight, airspace users want to depart and arrive at the times they select and fly the trajectory they determine to be optimum.
Download Data as PDF