- Health Status >
- Health Indicators >
- Health-Related Quality of Life
Health-Related Quality of Life
Narrative
Health-related quality of life has been defined as “an individual’s or group’s perceived physical and mental health over time.”1 Because health-related quality of life encompasses multiple aspects of health, it is often measured in different ways, including self-reported health status and the number of days in the past month that a person felt that either their physical or mental health was not good.
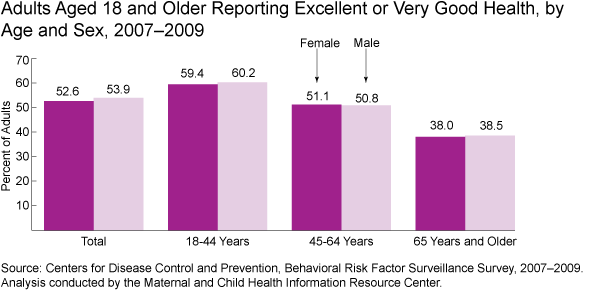
In 2007–2009, 53.2 percent of adults reported being in excellent or very good health, while 30.4 percent reported being in good health and 16.4 percent reported being in fair or poor health. Self-reported health status was similar among men and women, with 53.9 percent of men and 52.6 percent of women reporting excellent or very good health. Among both sexes, self-reported health status declined with age. Among women, those aged 65 years and older were least likely to report excellent or very good health (38.0 percent), compared to 59.4 percent of women aged 18–44 years.
The proportion of women reporting excellent or very good health also varied by race and ethnicity. More than half of non-Hispanic White, non-Hispanic Asian, and non-Hispanic Native Hawaiian/Other Pacific Islander women reported excellent or very good health. Hispanic, non-Hispanic American Indian/Alaska Native, and non-Hispanic Black women were least likely to report excellent or very good health (35.8, 39.3, and 40.9 percent, respectively).
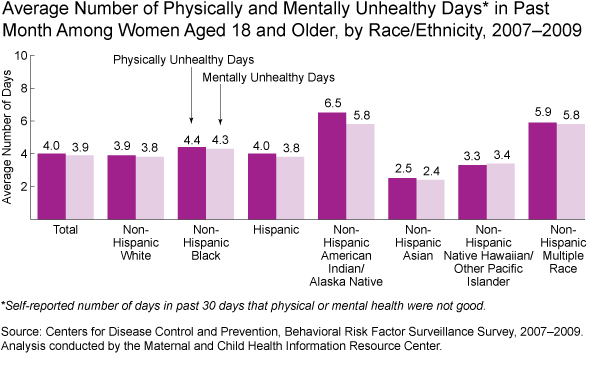
In 2007–2009, women reported more physically and mentally unhealthy days than men. Women reported an average of 4.0 days of poor physical health, compared to 3.2 days per month for men. Similarly, women reported an average of 3.9 mentally unhealthy days, while men reported an average of 2.9 days per month.
Among women, the average number of past-month physically and mentally unhealthy days varied by race and ethnicity. For both physical and mental health, non-Hispanic American Indian/Alaska Native and non-Hispanic women of multiple races reported the highest average number of unhealthy days in the past month (6.5 and 5.9 physically unhealthy days, respectively; 5.8 mentally unhealthy days for both groups). Non-Hispanic Asian women reported the lowest number of physically and mentally unhealthy days on average (2.5 and 2.4 unhealthy days, respectively).
1 Centers for Disease Control and Prevention. Health Related Quality of Life Concepts. Accessed 04/13/11.
Graphs
Data
| Age Group | Percent of Adults | |
|---|---|---|
| Female | Male | |
| Source: Centers for Disease Control and Prevention, Behavioral Risk Factor Surveillance Survey, 2007–2009. Analysis conducted by the Maternal and Child Health Information Resource Center. | ||
| 18-24 Years | 59.4 | 60.2 |
| 45-64 Years | 51.1 | 50.8 |
| 65 Years and Older | 38.0 | 38.5 |
| Total | 52.6 | 53.9 |
| Race/Ethnicity | Average Number of Days | |
|---|---|---|
| Physically Unhealthy Days | Mentally Unhealthy Days | |
|
*Self-reported number of days in past 30 days that physical or mental health were not good. Source: Centers for Disease Control and Prevention, Behavioral Risk Factor Surveillance Survey, 2007–2009. Analysis conducted by the Maternal and Child Health Information Resource Center. |
||
| Non-Hispanic White | 3.9 | 3.8 |
| Non-Hispanic Black | 4.4 | 4.3 |
| Hispanic | 4.0 | 3.8 |
| Non-Hispanic American Indian/Alaska Native | 6.5 | 5.8 |
| Non-Hispanic Asian | 2.5 | 2.4 |
| Non-Hispanic Native Hawaiian/Other Pacific Islander | 3.3 | 3.4 |
| Non-Hispanic Multiple Race | 5.9 | 5.8 |
| Total | 4.0 | 3.9 |


