Data collected from more than 200,000 people between 2006 and 2008 show that substance use disorders vary extensively among regions within each State and throughout the country
Past year alcohol use disorders ranged from 4.8 percent in a substate region in southern Pennsylvania to 14.6 percent in a region in the District of Columbia
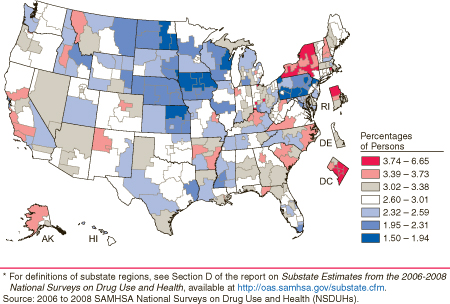
Past year illicit drug use disorders ranged from 1.5 percent in 2 substate regions in southern Pennsylvania to 6.7 percent in a region in the District of Columbia
Substance use disorders (substance dependence or abuse) have a tremendous impact on the lives of our citizens, imposing burdens on individuals, families, communities, and governments. Nevertheless, substance use disorders are not distributed equally across all States,1 and within each State there are different patterns of substance use problems in different regions. Data on small geographic areas provide insight into the nature and scope of substance use problems and help State and local public health authorities to better understand and effectively address the needs in their communities.
The National Survey on Drug Use and Health (NSDUH) can help address the need for more localized information. This issue of The NSDUH Report highlights substate estimates of alcohol and illicit drug use disorders and presents information on 21 key measures of substance abuse and mental health. Data were extracted from a larger report titled Substate Estimates from the 2006-2008 National Surveys on Drug Use and Health.2
NSDUH asks persons aged 12 or older questions to assess symptoms of substance use disorders during the past year using criteria in the Diagnostic and Statistical Manual of Mental Disorders (DSM-IV).3 It includes such symptoms as withdrawal, tolerance, use in dangerous situations, trouble with the law, and interference in major obligations at work, school, or home during the past year. Findings in this report are based on combined 2006 to 2008 NSDUH data and present estimates of past year alcohol use disorders and past year illicit drug use disorders for 344 substate regions within the 50 States and the District of Columbia.4
Substate regions were defined collaboratively by staff at the Substance Abuse and Mental Health Services Administration (SAMHSA) and State substance abuse treatment representatives. State officials made the final decisions on the geographic boundaries. In most States, the substate regions are defined in terms of counties or groups of counties; in some States, the regions are defined in terms of census tracts (or parishes in Louisiana and boroughs/census areas in Alaska). For each of the 21 measures presented in the complete report, estimates for the substate regions nationwide were ranked from lowest to highest and grouped into seven categories.5
The estimates in this report and the full report were derived from a statistical model in which substate data from NSDUH were combined with other local area data to provide enhanced precision.
Alcohol Use Disorders at the Substate Level
Nationally, 7.5 percent of all persons aged 12 or older were classified as having alcohol use disorders in the past year. Estimates ranged from 4.8
percent in a region in southern Pennsylvania to 14.6 percent in the District of Columbia's Ward 2 (Figure 1).6,7
Of the 15 substate regions with the highest rates of alcohol use disorders, 7 were in the Midwest, 5 were in the West, and 3 were in the District of Columbia.
Figure 1. Alcohol Use Disorders in the Past Year among Persons Aged 12 or Older, by Substate Region*: Percentages, Annual Averages Based on 2006 to 2008 NSDUHs
Illicit Drug Use Disorders at the Substate Level
Nationally, 2.8 percent of all persons aged 12 or older were classified as having illicit drug use disorders in the past year. Estimates ranged from 1.5 percent in 2 substate regions in Pennsylvania to 6.7 percent in the District of Columbia's Ward 5 (Figure 2).6,8
Of the 14 substate regions with the highest rates of illicit drug use disorders, 7 were in the District of Columbia and Maryland, 5 were in Michigan and Ohio, and 2 were in New York and Rhode Island.
Figure 2. Illicit Drug Use Disorders in the Past Year among Persons Aged 12 or Older, by Substate Region*: Percentages, Annual Averages Based on 2006 to 2008 NSDUHs
Variations within States
Although not highlighted in the main report, regions within the same State can vary in the prevalence of drug and alcohol disorders, as illustrated in Figures 1 and 2. In Ohio, for example, alcohol use disorders ranged from 6.4 percent in a region in the south-central part of the State9 to 9.5 percent in Franklin County. Illicit drug disorders in Ohio ranged from 2.3 percent in a region in the southwestern part of the State10 to 4.1 percent in Franklin County.
Discussion
Data in this NSDUH Report and in the full report highlight that substance use varies among and within States. These data can be used to help States more effectively allocate funds for prevention and treatment programs.
Complete Report
The full report with estimates for 21 measures of substance use is available online at http://samhsa.gov/data/substate.cfm. National maps for all measures for the 344 substate regions, detailed tables for the substate regions, and definitions and population counts for the substate regions also are provided. The complete report gives a general description of the methodology used to generate the model-based estimates.
End Notes1Office of Applied Studies. (2010). State estimates of substance use from the 2007-2008 National Surveys on Drug Use and Health (HHS Publication No. SMA 10-4472, NSDUH Series H-37). Rockville, MD: Substance Abuse and Mental Health Services Administration. [Available at http://samhsa.gov/data/states.cfm] 2Office of Applied Studies. (2010). Substate estimates from the 2006-2008 National Surveys on Drug Use and Health. Rockville, MD: Substance Abuse and Mental Health Services Administration. [Web-only report available at http://samhsa.gov/data/substate.cfm] 3American Psychiatric Association. (1994). Diagnostic and statistical manual of mental disorders (4th ed.). Washington, DC: Author. 4NSDUH defines illicit drugs as marijuana/hashish, cocaine (including crack), inhalants, hallucinogens, heroin, or prescription-type drugs used nonmedically. Nonmedical use is defined as use of prescription-type pain relievers, sedatives, stimulants, or tranquilizers not prescribed for the respondent by a physician or used only for the experience or feeling they caused. Nonmedical use of prescription-type drugs does not include over-the-counter drugs; nonmedical use of stimulants includes methamphetamine use. 5In the national maps shown in this NSDUH Report, the third of the substate regions with the lowest prevalence rates are presented in blue (ranging from dark to light blue), the middle third of the regions in white, and the highest third of the regions in red (ranging from light to dark red). The darkest shades represent the regions with the lowest (dark blue) and highest (dark red) prevalence rates. 6One substate region in Pennsylvania consists of Adams, Dauphin, Lancaster, Lebanon, and York counties. The other Pennsylvania region consists of Blair, Cumberland, Perry, Franklin, Fulton, Huntingdon, Juniata, Mifflin, and Bedford counties. 7Ward 2 includes census tracts primarily in the western part of the District of Columbia. 8Ward 5 includes census tracts primarily in the eastern part of the District of Columbia. 9This substate region consists of Adams, Fayette, Gallia, Highland, Jackson, Lawrence, Meigs, Pickaway, Pike, Ross, and Scioto counties. 10This substate region consists of Brown, Clermont, Clinton, and Warren counties.
Suggested CitationSubstance Abuse and Mental Health Services Administration, Office of Applied Studies. (August 2010). The NSDUH Report: Substance Use Disorders in Substate Regions. Rockville, MD.
The National Survey on Drug Use and Health (NSDUH) is an annual survey sponsored by the Substance Abuse and Mental Health Services Administration (SAMHSA). The 2006 to 2008 data used in this report are based on information obtained from 204,408 persons aged 12 or older. The survey collects data by administering questionnaires to a representative sample of the population through face-to-face interviews at their place of residence.
The NSDUH Report is prepared by the Office of Applied Studies (OAS), SAMHSA, and by RTI International in Research Triangle Park, North Carolina. (RTI International is a trade name of Research Triangle Institute.)
Information on the most recent NSDUH is available in the following publication:
Office of Applied Studies. (2009). Results from the 2008 National Survey on Drug Use and Health: National findingsem> (HHS Publication No. SMA 09-4434, NSDUH Series H-36). Rockville, MD: Substance Abuse and Mental Health Services Administration. Also available online: http://oas.samhsa.gov.
The NSDUH Report is published periodically by the Office of Applied Studies, Substance Abuse and Mental Health Services Administration (SAMHSA). All material appearing in this report is in the public domain and may be reproduced or copied without permission from SAMHSA. Additional copies of this report or other reports from the Office of Applied Studies are available online: http://oas.samhsa.gov. Citation of the source is appreciated. For questions about this report, please e-mail: shortreports@samhsa.hhs.gov.