National Household Survey on Drug Abuse Low Rates of Alcohol Use among Asian Youths Report

September 13, 2002

Low Rates of Alcohol Use among Asian Youths

In Brief

  • Asian youths were less likely to have used alcohol during the past year than Hispanic, white, or American Indian/Alaska Native youths
  • Asian youths were more likely than youths from other racial/ethnic groups to believe that their parents would strongly disapprove of their drinking one or two alcoholic beverages nearly every day
  • Asian youths were more likely than youths from other racial/ethnic groups to have perceived great risk from having five or more drinks of an alcoholic beverage once or twice a week

The National Household Survey on Drug Abuse (NHSDA) asks respondents aged 12 or older about alcohol use, including the quantity and frequency of use.1 Respondents aged 12 to 17 were asked to report how they thought their parents would feel about their having one or two drinks of an alcoholic beverage nearly every day.2 Youths were also asked to report how much they felt people risk harming themselves physically and in other ways when they have five or more drinks of an alcoholic beverage once or twice a week.3 Responses were analyzed by racial/ethnic subgroups for comparative purposes.


Prevalence of Alcohol Use
According to the 2000 NHSDA, approximately 835,000 youths aged 12 to 17 in the United States were Asian. Asian youths were less likely to have used alcohol during the past year than Hispanic, white, or American Indian/Alaska Native youths (Figure 1). Asian youths were also less likely to engage in binge or heavy alcohol use than Hispanic, white, or American Indian/Alaska Native youths.

Combined 1999 and 2000 data show that among Asian youths, females (19 percent) were less likely than males (26 percent) to have used alcohol during the past year (Figure 2). Among youths from other racial/ethnic groups, females (35 percent) were more likely to have used alcohol during the past year than males (33 percent).

Figure 1. Percentages of Youths Aged 12 to 17 Reporting Past Year Alcohol Use, "Binge" Alcohol Use,† or Heavy Alcohol Use,† by Race/Ethnicity: 2000

Figure 2. Percentages of Youths Aged 12 to 17 Reporting Past Year Alcohol Use, by Race/Ethnicity and Gender: Annual Averages Based on 1999 and 2000 NHSDAs

Figure 1.  Percentages of Youths Aged 12 to 17 Reporting Past Year Alcohol Use, Binge Alcohol Use,† or Heavy Alcohol Use,† by Race/Ethnicity:  2000 Figure 2.  Percentages of Youths Aged 12 to 17 Reporting Past Year Alcohol Use, by Race/Ethnicity and Gender:  Annual Averages Based on 1999 and 2000 NHSDAs

Variations Across Asian Subgroups
Combined 1999 and 2000 data show that Filipino youths were more likely to have used alcohol during the past year than Chinese or Asian Indian youths (Figure 3). However, the rates of binge drinking for Asian Indians and Filipino youths were similar, and both were higher than the rate for Chinese youths (Figure 4).

Perceptions of Parental Attitudes Regarding Alcohol Use

Previous research has shown lower rates of substance use among youths whose parents disapproved of such use than among youths whose parents did not disapprove.4,5 The 2000 NHSDA found that Asian youths were more likely to think their parents would strongly disapprove of their drinking one or two alcoholic beverages nearly every day (92 percent) compared with youths from other racial/ethnic groups (88 percent).


Perceived Risk of Alcohol Use
Past research indicates a relationship between substance use and perception of risk associated with use; substance use is generally lower among those who perceive great risk associated with use.5 Asian youths (51 percent) were more likely than youths from other racial/ethnic groups (43 percent) to perceive great risk of having five or more drinks of an alcoholic beverage once or twice a week.

Figure 3. Percentages of Asian Youths Aged 12 to 17 Reporting Past Year Alcohol Use, by Racial/Ethnic Subgroups: Annual Averages Based on 1999 and 2000 NHSDAs

Figure 4. Percentages of Asian Youths Aged 12 to 17 Reporting "Binge" Alcohol Use, by Racial/Ethnic Subgroups: Annual Averages Based on 1999 and 2000 NHSDAs

Figure 3.  Percentages of Asian Youths Aged 12 to 17 Reporting Past Year Alcohol Use, by Racial/Ethnic Subgroups:  Annual Averages Based on 1999 and 2000 NHSDAs Figure 4.  Percentages of Asian Youths Aged 12 to 17 Reporting Binge Alcohol Use, by Racial/Ethnic Subgroups:  Annual Averages Based on 1999 and 2000 NHSDAs

End Notes

  1. Binge alcohol use was defined as drinking five or more drinks on the same occasion (at the same time or within a couple of hours of each other) on at least 1 day in the past 30 days. A drink was defined as a can or bottle of beer, a glass of wine or a wine cooler, a shot of liquor, or a mixed drink containing liquor. Heavy alcohol use was defined as drinking five or more drinks on the same occasion on each of 5 or more days in the past 30 days.
  2. The three response categories were (1) strongly disapprove, (2) somewhat disapprove, or (3) neither approve nor disapprove.
  3. The four response categories were (1) no risk, (2) slight risk, (3) moderate risk, or (4) great risk.
  4. Hawkins, J.D., Catalano, R.F., & Miller, J.Y. (1992). Risk and protective factors for alcohol and other drug problems in adolescence and early adulthood: Implications for substance abuse prevention. Psychological Bulletin, 112, 64-105.
  5. Lane, J., Gerstein, D., Huang, L., & Wright, D. (2001). Risk and protective factors for adolescent drug use: Findings from the 1997 National Household Survey on Drug Abuse (Analytic Series: A-12, DHHS Publication No. SMA 01-3499). Rockville, MD: Substance Abuse and Mental Health Services Administration.


Figure Notes

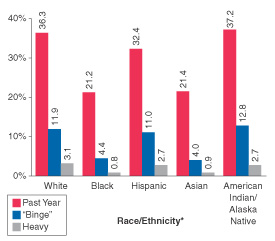
† "Binge" Alcohol Use is defined as drinking five or more drinks on the same occasion on at least 1 day in the past 30 days. By "occasion" is meant at the same time or within a couple hours of each other. Heavy Alcohol Use is defined as drinking five or more drinks on the same occasion on each of 5 or more days in the past 30 days; all Heavy Alcohol Users are also "Binge" Alcohol Users.

* Native Hawaiian/Other Pacific Islander and youths reporting more than one race are not included in these analyses.

** Includes white, black, American Indian/Alaska Native, Hispanic, Native Hawaiian/Other Pacific Islander, and more than one race.

*** This table is not an exhaustive summary of all racial/ethnic subgroups. Native Hawaiian, Other Pacific Islander, and Vietnamese respondents and those who reported a racial/ethnic subgroup that is rare in the United States, or who reported more than one racial/ethnic subgroup, are not included.

Source (Figure 1): SAMHSA 2000 NHSDA; (Figures 2-4): SAMHSA 1999 and 2000 NHSDAs.

The National Household Survey on Drug Abuse (NHSDA) is an annual survey sponsored by the Substance Abuse and Mental Health Services Administration (SAMHSA). The 1999 and 2000 data are based on information obtained from nearly 142,000 persons aged 12 or older (about 70,000 each year), including more than 50,000 youths aged 12 to 17 (more than 25,000 each year). The survey collects data by administering questionnaires to a representative sample of the population through face-to-face interviews at their place of residence.

The NHSDA Report is prepared by the Office of Applied Studies (OAS), SAMHSA, and by RTI in Research Triangle Park, North Carolina.

Information and data for this issue are based on the following publications and statistics:

Substance Abuse and Mental Health Services Administration. (2000). Summary of findings from the 1999 National Household Survey on Drug Abuse (NHSDA Series: H-12, DHHS Publication No. SMA 00-3466). Rockville, MD: Author.

Substance Abuse and Mental Health Services Administration. (2001). Summary of findings from the 2000 National Household Survey on Drug Abuse (NHSDA Series: H-13, DHHS Publication No. SMA 01-3549). Rockville, MD: Author.

Also available on-line from http://www.oas.samhsa.gov/nsduh.htm.

Additional Tables 2.46B, 2.51B, 2.61B, and 2.66B from http://www.oas.samhsa.gov/nhsda/2kdetailedtabs/Vol_1_Part_2/V1P2.htm

and Tables 3.12B, 3.30B, and 7.2A from http://www.oas.samhsa.gov/nhsda/2kdetailedtabs/Vol_1_Part_3/V1P3.htm.

Additional tables available upon request.

The NHSDA Report is published periodically by the Office of Applied Studies, Substance Abuse and Mental Health Services Administration (SAMHSA). All material appearing in this report is in the public domain and may be reproduced or copied without permission from SAMHSA. Additional copies of this fact sheet may be downloaded from Other reports from the Office of Applied Studies are also available on-line on the OAS home page: http://www.oas.samhsa.gov

This page was last updated on December 31, 2008.