Figure 1. Estimated Numbers (in Millions) of Persons Aged 18 or Older Reporting Past Month Tobacco Use: 2000
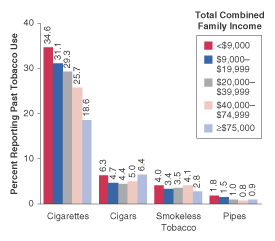
Figure 2. Percentages of Persons Aged 18 or Older Reporting Past Month Tobacco Use, by Total Combined Family Income: 1999 and 2000


May 3, 2002 |
| Tobacco Use, Income, and Educational Level |
|
In Brief |
|
| The National Household Survey on Drug Abuse (NHSDA) asks respondents to report their use of tobacco products during the month before the survey interview. Tobacco products include cigarettes, cigars, smokeless tobacco (i.e., chewing tobacco or snuff), and pipe tobacco. Respondents are also asked for their total combined family income for the previous calendar year and for the highest grade or year of school they had completed. This report focuses on responses of persons aged 18 or older to estimate the prevalence of tobacco use across different levels of income and education. Analyses of the relationships between tobacco use and income and educational level are based on data combined from the 1999 and 2000 surveys. |
|
Prevalence of Tobacco Use According to the 2000 NHSDA, an estimated 62 million persons aged 18 or older (31 percent) had used one or more tobacco products during the past month (Figure 1). Approximately 53 million (26 percent) smoked cigarettes, 10 million (5 percent) smoked cigars, 7 million (4 percent) used smokeless tobacco, and 2 million (1 percent) smoked pipes. |
|
Tobacco Use and Income Persons aged 18 or older from lower-income families were more likely than persons from families with higher incomes to use most tobacco products in the past month (Figure 2). For example, 35 percent of persons with total combined family incomes of less than $9,000 reported smoking cigarettes during the past month compared with 29 percent of those from families with incomes between $20,000 and $39,999 and 19 percent of those from families with incomes of $75,000 or more. Persons with total combined family incomes of less than $75,000 were more likely than those with incomes of $75,000 or more to use smokeless tobacco during the past month. Similarly, persons with total combined family incomes of less than $20,000 were more likely than those with total incomes of more than $20,000 to smoke pipes during the past month. In contrast, persons with total combined family incomes of $75,000 or more were more likely than those with incomes between $9,000 and $74,999 to smoke cigars during the past month. |
|
Figure 1. Estimated Numbers (in Millions) of Persons Aged 18 or Older Reporting Past Month Tobacco Use: 2000 |
Figure 2. Percentages of Persons Aged 18 or Older Reporting Past Month Tobacco Use, by Total Combined Family Income: 1999 and 2000 |
|
|
|
|
Tobacco Use and Educational Level Persons aged 18 or older with lower levels of completed education were more likely than those with higher levels of education to use most tobacco products during the past month (Figure 3). For example, 33 percent of persons who did not complete high school reported past month cigarette use compared with 28 percent of those who completed between 1 and 3 years of college and 14 percent of those who completed 4 years of college.1 Almost 5 percent of persons who did not complete 12th grade reported past month smokeless tobacco use compared with 2 percent of those who completed 4 years of college. In contrast, persons who completed between 1 and 3 years of college were more likely to report past month cigar use than persons at any other educational level. The prevalence of past month pipe use was low for all educational levels, but persons without a high school education were more likely to report past month pipe use than persons who had completed at least high school. | ||||
|
Cigarette Use, Income, and Educational Level Because persons with higher levels of education generally have higher incomes, the relationship between income, educational level, and tobacco use was examined. Findings for past month cigarette use among persons aged 18 or older are presented in Figure 4. Among persons who had completed at least some college, past month cigarette use was generally higher among persons from families with lower incomes than among those from families with higher incomes. Among persons who had completed a high school education or less, past month cigarette use was not consistently related to income level. Past month cigarette use was lowest at all income levels among college graduates.
|
|
End Note 1 According to the combined 1999 and 2000 NHSDA data, approximately 18 percent of persons aged 18 or older who reported that they completed less than 4 years of college were current college students when the survey interview was administered.
Figure Notes * "Any Tobacco Product" indicates use of cigarettes, cigars, smokeless tobacco (i.e., chewing tobacco or snuff), or pipe tobacco at least once in the month prior to the survey. Source (Figure 1): SAMHSA 2000 NHSDA. Source (Figures 2-4): SAMHSA 1999 and 2000 NHSDAs.
|
|
This page was last updated on December 31, 2008. |

