 |
| May 30, 2003 |
Graphing Multi-year Analyses of TEDS
| In Brief |
- Over 80 studies, including the 1992-2000 TEDS, are publicly available from the Substance Abuse and Mental Health Data Archive (SAMHDA) at http://www.icpsr.umich.edu/SAMHDA
- Program administrators, researchers, and others with Internet access may run their own online analyses without using specialized software
- Contact the archive staff for assistance at samhda@icpsr.umich.edu or toll-free at
(888) 741-7242
|
A combined file for the 1995-2000 Treatment Episode Data Set (TEDS) is available from the Substance Abuse and Mental Health Data Archive (SAMHDA)1 using the archive's online data analysis system (DAS).2 This file contains 9.6 million records and is useful for conducting geographic comparisons and analyzing changes over time.3 (The procedures described in this report only work with MS Internet Explorer, version 5 or higher.)
Access the SAMHDA homepage at http://www.icpsr.umich.edu/SAMHDA, click on "Online Analysis," select Treatment Episode Data Set, and select the TEDS 1995-2000 concatenated file.4 For this exercise, then click on the button for "Run frequency or crosstabulation" and click on "Start."
Example 1: Admissions Involving Heroin by Year and Census Region
To examine trends in admissions that included heroin as a primary, secondary, or tertiary substance of abuse in the four Census regions of the country, run a cross-tabulation using the variables:
- Heroin Flag (variable name herflg), which denotes whether heroin was mentioned as a drug of abuse at admission;
- Year (variable name year);
- Census Region (variable name region).
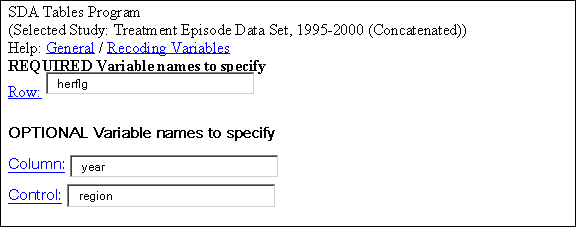
All variables and codes are specified in the online TEDS codebooks. Use region as the control variable to produce a separate table for each of the four Census regions, as well as a table that includes all four regions. The input screen is shown above (Figure 1).
|
Figure 1. Excerpt of Input Screen
|
 |
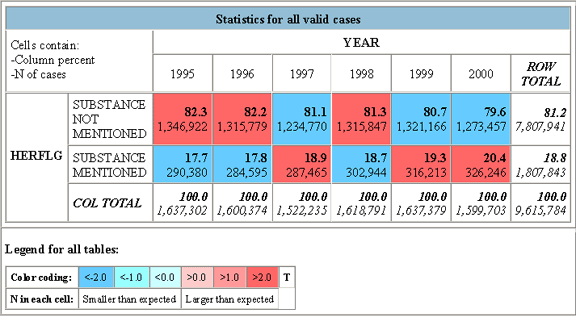
For all regions combined, the percentage of admissions involving heroin showed statistically significant increases in 1997 (18.9 percent), decreases in 1998 (18.7 percent), and
increases again in 1999 and 2000 (19.3 and 20.4 percent, respectively). The color-coding indicates the strength of the statistical results, as displayed in the legend (Figure 2).
| Figure 2. Admissions Involving Heroin, All Regions: 1995-2000
|
 |
Figures 3-6 show the tables produced for each region of the country, beginning with the Western region. These results show that, in the West, heroin admissions were highest 1995-1996 (26.4 and 26.1 percent, respectively), followed by decreases beginning in 1997 (24.6 percent) and statistically significant decreases in 1998-2000 (21.4 to 21.7 percent). However, the other three regions show the opposite trend, with lower percentages of admissions involving heroin in 1995-1996, followed by increases beginning in 1997 that were statistically significant in 1998-2000.
|
Figure 3. Admissions Involving Heroin, West: 1995-2000
|
| |
|
Figure 4. Admissions Involving Heroin, South: 1995-2000
|
| |
|
Figure 5. Admissions Involving Heroin, Midwest: 1995-2000
|
| |
|
Figure 6. Admissions Involving Heroin, Northeast: 1995-2000
|
| |
Example 2: Graphing Results
Using these results and a spreadsheet software program such as Microsoft Excel, graphs can be created to depict trends, which are often clearer when represented visually. To create a line graph of the heroin admissions in Figures 2-6 using Excel:
- Open Excel5 and cut and paste the row "Substance Mentioned" of each table into a spreadsheet. This will copy as two rows in Excel; one for the percentages and one for N of cases. This example will include percentages only; delete the N of cases rows from the spreadsheet. Add column and row titles. Figure 7 shows the cells to be graphed.
| Figure 7. Spreadsheet with Percentage of Heroin Admissions, by Year and Region: 1995-2000
|
| |
- Remain in the spreadsheet and click on the Chart Wizard icon. Select the "Standard Type" tab. Under "Chart Type," select "Line." Under "Chart Sub-type," the description of each chart sub-type displays when you click on each icon; select the graph "Line with markers displayed at each data value." (See Figure 8 for a completed screen for Step 1 of Chart Wizard.) Hit "Next."
| Figure 8. Selection of Chart Type
|
|
- At the top of the next window, select the "Series" tab. At the bottom of the "Series" box, click "Add." Click in the "Name" box and enter "All regions" or cut and paste the label from the spreadsheet. In the "Values" box, delete the contents and click and drag across the columns in the spreadsheet for "All regions." This will insert the spreadsheet cells into the box. In the box "Category "X" axis labels," click and drag across the title row of the spreadsheet (1995-2000) or manually insert the years separated by commas.
- Click the "Add" button again and repeat this procedure for all rows. The label for the X axis need only be entered for the first series. The percentages along the Y axis automatically adjust as more data are entered. (Figure 9 shows the completed screen for Step 2.) Click "Next" when data for all regions have been entered.
| Figure 9. Input of Source Data
|
|
- On the next screen, under the "Titles" tab, insert a chart title and labels for the X and Y axis. See Figure 10. Click "Next" when all titles have been entered.
| Figure 10. Completion of Chart Options
|
|
- The final step is to save the chart, either as an object within the same spreadsheet in or in a new spreadsheet. Figure 11 provides an example, while Figure 12 shows the completed graph. When finished, hit "Finish."
| Figure 11. Saving Chart Location
|
|
| Figure 12. Completed Graph
|
|
End Notes
1 The archive is supported by the Office of Applied Studies, SAMHSA, and based at the Inter-university Consortium for Political and Social Research at the University of Michigan through a subcontract with the National Organization for Research at the University of Chicago (NORC).
2 The DAS is based on Survey Documentation and Analysis (SDA) software developed at the Computer-assisted Survey Methods (CSM) Program at the University of California at Berkeley.
3 Using the DAS, this file may also be used to subset and download records for a given State or metropolitan area.
4 See previous reports for further instruction on using the DAS - The DASIS Report: Analyzing TEDS Online
().
5 Excel 2002 was used to create this example.
The Drug and Alcohol Services Information System (DASIS) is
an integrated data system maintained by the Office of Applied Studies, Substance Abuse and Mental Health Services Administration (SAMHSA).
One component of DASIS is the Treatment Episode Data Set (TEDS). TEDS is a compilation of data on the demographic characteristics and
substance abuse problems of those admitted for substance abuse treatment. The information comes primarily from facilities that receive
some public funding. Information on treatment admissions is routinely collected by State administrative systems and then submitted to
SAMHSA in a standard format. Approximately 1.6 million records are included in TEDS each year. TEDS records represent admissions rather
than individuals, as a person may be admitted to treatment more than once.
The DASIS Report is prepared by the Office of Applied Studies, SAMHSA;
Synectics for Management Decisions, Inc., Arlington, Virginia; and
RTI, Research Triangle Park, North Carolina.
Information and data for this issue are based on data reported to TEDS through April 1, 2002.
Access the latest TEDS reports at:
www.oas.samhsa.gov/dasis.htm
Access the latest TEDS public use files at:
http://www.oas.samhsa.gov/SAMHDA.htm
Other substance abuse reports are available at:
http://www.oas.samhsa.gov
|
| The DASIS Report
is published periodically by the Office of Applied Studies, Substance
Abuse and Mental Health Services Administration (SAMHSA).
All material appearing in this report is in the public domain and
may be reproduced or copied without permission from SAMHSA. Additional
copies of this report or other reports from the Office of Applied
Studies are available on-line: http://www.oas.samhsa.gov.
Citation of the source is appreciated. |
|
This page was last updated on December 30, 2008.
|


