Banner image for The Dasis Report (Drug and Alcohol Information System)
Issue 14
2006

Non-Heroin Opiate Admissions: 2003

In Brief
  • In 2003, opiates other than heroin (non-heroin opiates) were the primary substance of abuse for 51,000 substance abuse treatment admissions (3 percent of all admissions)


  • Some 47 percent of non-heroin opiate admissions were female compared with 32 percent of heroin admissions


  • Non-heroin opiate admissions were more likely than heroin admissions to be entering treatment for the first time (40 vs. 22 percent)

Opiates were the primary substance of abuse1 for 324,000 (18 percent) of the 1.8 million substance abuse treatment admissions reported to the Treatment Episode Data Set (TEDS) in 2003. Of these primary opiate admissions, 273,000 (15 percent of all admissions) were for heroin and 51,000 (3 percent of all admissions) were for a non-heroin opiate. Opiates other than heroin—including codeine, morphine, opium, oxycodone, non-prescription methadone, and any other drug with morphine-like effects—are commonly prescribed as pain-relieving medications, but they may be abused, resulting in addiction or dependency. This report explores differences among admissions for non-heroin opiates and admissions for heroin, using the data on demographic characteristics and substance abuse problems of those admitted for substance abuse treatment that are compiled annually in TEDS. This information comes primarily from facilities that receive some public funding.


Secondary Substance of Abuse
Among admissions reporting a secondary substance of abuse,2 non-heroin opiate admissions were less likely than heroin admissions to report cocaine as the secondary substance (17 vs. 50 percent) and more likely to report marijuana (19 vs. 10 percent) and other drugs3 (20 vs. 5 percent) (Figure 1). Eleven percent of primary non-heroin opiate admissions with a secondary substance of abuse reported heroin as that secondary substance, and another three percent reported a second non-heroin opiate. Eight percent of primary heroin admissions reporting a secondary substance reported a non-heroin opiate.

Figure 1. Primary Non-Heroin and Heroin Opiate Admissions, by Secondary Substance of Abuse: 2003
Two pie charts comparing percent of Primary Non-Heroin and Heroin Opiate Admissions, by Secondary Substance of Abuse in 2003
Source: 2003 SAMHSA Treatment Episode Data Set (TEDS).
*Admissions can have non-heroin opiates as both primary and secondary substances of abuse if more than one non-heroin opiate drug
is reported at the time of admission (e.g., codeine and oxycodone).

Figure 1 Table. Percent of Primary Non-Heroin and Heroin Opiate Admissions, by Secondary Substance of Abuse in 2003
Secondary Substance Non-Heroin Opiates Heroin
Alcohol 26% 24%
Marijuana 19% 10%
Cocaine 17% 50%
Heroin 11% --
Stimulants 4% 3%
Non-Heroin Opiates 3%* 8%
Other 20% 5%
Source: 2003 SAMHSA Treatment Episode Data Set (TEDS).
*Admissions can have non-heroin opiates as both primary and secondary substances of abuse if more than one non-heroin opiate drug is reported at the time of admission (e.g., codeine and oxycodone).

Demographic and Socioeconomic Characteristics
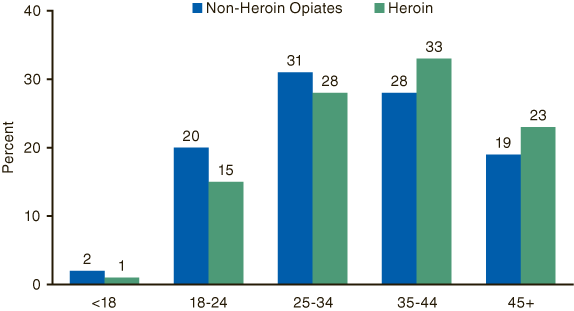
Compared to heroin admissions, non-heroin opiate admissions were predominantly White (89 vs. 48 percent), and correspondingly less likely to be Black (5 vs. 25 percent) or Hispanic (3 vs. 24 percent), but equally likely to be from other racial/ethnic groups (3 percent each). Some 47 percent of non-heroin opiate admissions were female compared with 32 percent of heroin admissions. Non-heroin opiate admissions were younger on average than heroin admissions (34.3 vs. 36.3 years old); in particular, non-heroin opiate admissions were more likely than heroin admissions to be 18 to 24 years old (20 vs. 15 percent) or 25 to 34 years old (31 vs. 28 percent) (Figure 2).

Non-heroin opiate admissions were more likely than heroin admissions to have some college education (32 vs. 17 percent) and to be employed full time (23 vs. 12 percent),4 but less likely (40 vs. 49 percent) to have some type of health insurance.5 Non-heroin opiate admissions were more likely than heroin admissions to report co-occurring psychiatric problems (26 vs. 14 percent).6


Figure 2. Primary Non-Heroin and Heroin Opiate Admissions, by Age: 2003
Bar chart comparing percent of Primary Non-Heroin and Heroin Opiate Admissions, by Age in 2003
Source: 2003 SAMHSA Treatment Episode Data Set (TEDS).

Figure 2 Table. Percent of Primary Non-Heroin and Heroin Opiate Admissions, by Age in 2003
Age Non-Heroin Opiates Heroin
<18 2% 1%
18-24 20% 15%
25-34 31% 28%
35-44 28% 33%
45+ 19% 23%
Source: 2003 SAMHSA Treatment Episode Data Set (TEDS).


Usage
On average, non-heroin opiate admissions were older than heroin admissions at the time of their first use of the drug (25.3 vs. 22.2 years old) and reported shorter durations of use (7.3 vs. 12.6 years). Most non-heroin opiate and heroin admissions reported daily use (67 vs. 78 percent), but non-heroin opiate admissions were more likely not to have used the drug in the past month (17 vs. 12 percent) than heroin admissions (Figure 3).

Figure 3. Primary Non-Heroin and Heroin Opiate Admissions, by Frequency of Use: 2003
Bar chart comparing percent of Primary Non-Heroin and Heroin Opiate Admissions, by Frequency of Use in 2003
Source: 2003 SAMHSA Treatment Episode Data Set (TEDS).

Figure 3 Table. Percent of Primary Non-Heroin and Heroin Opiate Admissions, by Frequency of Use in 2003
Frequency of Use Non-Heroin Opiates Heroin
Daily 67% 78%
3-6 Times in Past Week 8% 5%
1-2 Times in Past Week 3% 2%
1-3 Times in Past Month 5% 3%
No Use in Past Month 17% 12%
Source: 2003 SAMHSA Treatment Episode Data Set (TEDS).


Source of Referral
Non-heroin opiate admissions were more likely to be referred to treatment through self/individual referrals (49 vs. 59 percent) and general health care provider referrals (11 vs. 5 percent) than heroin admissions (Figure 4).

Figure 4. Primary Non-Heroin and Heroin Opiate Admissions, by Source of Referral: 2003
Bar chart comparing percent of Primary Non-Heroin and Heroin Opiate Admissions, by Source of Referral in 2003
Source: 2003 SAMHSA Treatment Episode Data Set (TEDS).

Figure 4 Table. Percent of Primary Non-Heroin and Heroin Opiate Admissions, by Source of Referral in 2003
Source of Referral Non-Heroin Opiates Heroin
Self/Individual 49% 59%
Criminal Justice System 16% 14%
Alcohol/Drug Abuse Care Provider 14% 15%
Other Health Care 11% 5%
Other Community 8% 7%
Other 2% 0%
Source: 2003 SAMHSA Treatment Episode Data Set (TEDS).


Service Setting
Non-heroin opiate admissions were less likely than heroin admissions to receive treatment in detoxification service settings (29 vs. 35 percent), about as likely to receive treatment in rehabilitation/residential settings (16 vs. 14 percent), and more likely to receive treatment in ambulatory settings (55 vs. 52 percent).7


Prior Treatment
Non-heroin opiate admissions were more likely to be entering treatment for the first time (40 vs. 22 percent), and less likely to report having five or more prior treatments (9 vs. 23 percent).


End Notes
1 The primary substance of abuse is the main substance reported at the time of admission.
2 Secondary substances are other substances of abuse also reported at the time of admission.
3 Other substances include phenylcyclidine (PCP), hallucinogens, benzodiazepines and other tranquilizers, barbiturates, other sedatives or hypnotics, inhalants, and over-the-counter medications.
4 Analysis of employment status includes admissions 19 to 64.
5 Health insurance, a Supplemental Data Set item, was reported for at least 75 percent of all admissions in 31 States and jurisdictions in 2003. These 31 States accounted for 53 percent of all substance abuse treatment admissions in 2003. In 2003, these States were: AK, AR, AZ, CO, DC, DE, FL, GA, HI, ID, IL, IN, KS, KY, MA, MD, MO, MS, MT, ND, NE, NH, NJ, NV, OK, OR, PA, PR, SC, TX, and UT.
6 Psychiatric problem in addition to alcohol or drug problem, a Supplemental Data Set item, was reported for at least 75 percent of all admissions in 29 States and jurisdictions in 2003. These 29 States accounted for 46 percent of all substance abuse treatment admissions in 2003. In 2003, these States were: CA, CO, DC, DE, FL, IA, ID, KS, KY, LA, MA, MD, ME, MI, MO, MS, NC, ND, NJ, NM, NV, OH, OK, PR, RI, SC, TN, UT, and WA.
7 Service settings are of three types: ambulatory, residential/rehabilitative, and detoxification. Ambulatory settings include intensive outpatient, non-intensive outpatient, and ambulatory detoxification. Residential/rehabilitative settings include hospital (other than detoxification), short-term (30 days or fewer), and long-term (more than 30 days). Detoxification includes 24-hour hospital inpatient and 24-hour free-standing residential.

The Drug and Alcohol Services Information System (DASIS) is an integrated data system maintained by the Office of Applied Studies, Substance Abuse and Mental Health Services Administration (SAMHSA). One component of DASIS is the Treatment Episode Data Set (TEDS). TEDS is a compilation of data on the demographic characteristics and substance abuse problems of those admitted for substance abuse treatment. The information comes primarily from facilities that receive some public funding. Information on treatment admissions is routinely collected by State administrative systems and then submitted to SAMHSA in a standard format. TEDS records represent admissions rather than individuals, as a person may be admitted to treatment more than once. State admission data are reported to TEDS by the Single State Agencies (SSAs) for substance abuse treatment. There are significant differences among State data collection systems. Sources of State variation include completeness of reporting, facilities reporting TEDS data, clients included, and treatment resources available. See the annual TEDS reports for details. Approximately 1.8 million records are included in TEDS each year.

The DASIS Report is prepared by the Office of Applied Studies, SAMHSA; Synectics for Management Decisions, Inc., Arlington, Virginia; and by RTI International in Research Triangle Park, North Carolina (RTI International is a trade name of Research Triangle Institute).


Information and data for this issue are based on data reported to TEDS through April 11, 2005.

Access the latest TEDS reports at:
http://www.oas.samhsa.gov/dasis.htm

Access the latest TEDS public use files at:
http://www.oas.samhsa.gov/SAMHDA.htm

Other substance abuse reports are available at:
http://www.oas.samhsa.gov

The DASIS Report is published periodically by the Office of Applied Studies, Substance Abuse and Mental Health Services Administration (SAMHSA). All material appearing in this report is in the public domain and may be reproduced or copied without permission from SAMHSA. Additional copies of this report or other reports from the Office of Applied Studies are available on-line: http://www.oas.samhsa.gov. Citation of the source is appreciated. For questions about this report please e-mail: shortreports@samhsa.hhs.gov

This page was last updated on December 30, 2008.