 |
| October 4, 2007 |
Substance Use Treatment among Women of Childrearing Age
In Brief
- Combined data from 2004 to 2006 indicate that an annual average of 6.3 million women aged 18 to 49 (9.4 percent) needed treatment for a substance use problem
- One in ten (10.4 percent) of the women aged 18 to 49 who needed treatment in the past year received treatment at a specialty substance use treatment facility
- Of the women aged 18 to 49 who needed treatment in the past year, 5.5 percent felt they needed treatment but did not receive it, and 84.2 percent neither received treatment nor perceived a need for it
|
Research suggests that most people who have a substance use problem do not receive treatment.1 In 2006, 7.4 million women aged 18 or older needed treatment for a substance abuse disorder involving alcohol or illicit drugs, but only 822,000 (11.2 percent) received treatment.2 This report focuses on substance use treatment among women of childrearing age (18 to 49), for whom substance use may pose particular risks to vulnerable offspring.
The National Survey on Drug Use and Health (NSDUH) asks persons aged 12 or older to report on their use of alcohol and illicit drugs,3 as well as symptoms of substance dependence or abuse during the past year. NSDUH defines dependence on or abuse of illicit drugs or alcohol using criteria specified in the Diagnostic and Statistical Manual of Mental Disorders (DSM-IV),4 which includes such symptoms as withdrawal, tolerance, use in dangerous situations, trouble with the law, and interference in major obligations at work, school, or home during the past year.
Respondents also are asked about the treatment they received for a substance use problem. For these analyses, an individual is defined as having received treatment only if he or she reported receiving specialty treatment for alcohol or illicit drug use in the past year.5 Persons are classified as needing treatment for a substance use problem if they met the criteria for dependence on or abuse of a substance or if they received specialty substance use treatment in the past year. Respondents also were asked whether there was any time during this period when they felt they needed treatment or counseling for their alcohol or illicit drug use but did not receive it. Persons who felt the need for treatment but did not receive it were asked about their reasons for not receiving substance use treatment.
This report presents estimates of substance use treatment need, receipt of treatment, perceived need for treatment, and reasons for not receiving treatment among women of childrearing age (i.e., women aged 18 to 49). All findings presented in this report are annual averages based on combined 2004, 2005, and 2006 NSDUH data.
Need for Substance Use Treatment
Combined data from 2004 to 2006 indicate that an annual average of 9.4 percent of women aged 18 to 49 (an estimated 6.3 million women annually) needed treatment for a substance use problem. Women aged 18 to 25 were more likely to need substance use treatment (16.9 percent) than women aged 26 to 34 (8.2 percent) or those aged 35 to 49 (6.5 percent). American Indian or Alaska Native women and women of two or more races were more likely to have met the criteria for past year substance use treatment need than women in other racial/ethnic groups (21.5 and 17.0 percent, respectively) (Figure 1).
Figure 1. Percentages of Women Aged 18 to 49 Who Needed Treatment in the Past Year, by Race/Ethnicity*: 2004-2006
 |
Figure 1 Table. Percentages of Women Aged 18 to 49 Who Needed Treatment in the Past Year, by Race/Ethnicity*: 2004-2006
| Race/Ethnicity |
Percent |
| White |
10.7% |
| Black or African American |
7.8% |
| American Indian or Alaska Native |
21.5% |
| Native Hawaiian or Other Pacific Islander |
9.5% |
| Asian |
3.9% |
| Two or More Races |
17.0% |
| Hispanic |
6.4% |
| Source: SAMHSA, 2004, 2005, and 2006 NSDUHs. |
Women with lower family incomes were more likely to have been classified as needing substance use treatment in the past year than women with higher family incomes. Approximately 14.3 percent of women with a family income of less than $20,000 per year were classified as needing substance use treatment compared with 9.0 percent of women with a family income of $20,000 to $49,999, 7.5 percent with a family income of $50,000 to $74,999, and 7.4 percent with a family income of $75,000 or more. Women who did not have children under the age of 18 were more likely to have met the criteria for past year substance use treatment need than women who had one or more children under the age of 18 (13.8 vs. 5.9 percent).6
Receipt of Substance Use Treatment
Of the 6.3 million women aged 18 to 49 who needed treatment in the past year, 10.4 percent received treatment at a specialty substance use treatment facility. Among women who needed treatment, those aged 35 to 49 and those aged 26 to 34 were more likely than women aged 18 to 25 to have received substance use treatment in the past year (13.7, 12.0, and 6.9 percent, respectively). Among women aged 18 to 49 who needed treatment, those with family incomes of less than $20,000 were more likely to have received treatment at a specialty substance use treatment facility in the past year than those with higher family incomes. Women who had one or more children under the age of 18 were more likely than women who did not have children under the age of 18 to have needed and received substance use treatment in the past year (13.1 vs. 8.8 percent).
Perceived Need for Substance Use Treatment
Of the women who were classified as needing substance use treatment in the past year, 84.2 percent neither received it nor perceived the need for it (Figure 2). Only 5.5 percent of women aged 18 to 49 had a perceived unmet treatment need (i.e., did not receive substance use treatment even though they thought they needed it).
Figure 2. Receipt of and Perceived Need for Substance Use Treatment in the Past Year among Women Aged 18 to 49 Who Needed Treatment: 2004-2006
 |
Figure 2 Table. Receipt of and Perceived Need for Substance Use Treatment in the Past Year among Women Aged 18 to 49 Who Needed Treatment: 2004-2006
| Receipt of and Perceived Need for Substance Use Treatment |
Percent |
| Received Treatment |
10.4% |
| Did Not Receive Treatment, But Perceived a Need for Treatment |
5.5% |
| Did Not Receive Treatment and Did Not Perceive a Need for Treatment |
84.2% |
Note: A total of 6.3 million women aged 18 to 49 needed substance use treatment in the past year.
Source: SAMHSA, 2004, 2005, and 2006 NSDUHs. |
Reasons for Not Receiving Substance Use Treatment
Of the 345,000 women aged 18 to 49 who needed and felt the need for substance use treatment in the past year, but did not receive specialty substance use treatment, 36.1 percent indicated they did not receive it because they were not ready to stop using alcohol or illicit drugs, 34.4 percent did not have health insurance coverage and could not afford to pay for the cost of treatment or had health insurance but it did not cover treatment or the cost of services, and 28.9 percent said they did not receive substance use treatment because of social stigma (Figure 3).
Figure 3. Percentages of Reasons** for Not Receiving Substance Use Treatment in the Past Year among Women Aged 18 to 49 Who Needed Treatment and Who Perceived a Need for It: 2004-2006
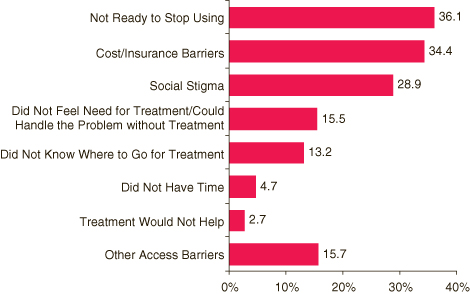 |
Figure 3 Table. Percentages of Reasons** for Not Receiving Substance Use Treatment in the Past Year among Women Aged 18 to 49 Who Needed Treatment and Who Perceived a Need for It: 2004-2006
| Reasons for Not Receiving Substance Use Treatment |
Percent |
| Not Ready to Stop Using |
36.1% |
| Cost/Insurance Barriers |
34.4% |
| Social Stigma |
28.9% |
| Did Not Feel Need for Treatment/Could Handle the Problem without Treatment |
15.5% |
| Did Not Know Where to Go for Treatment |
13.2% |
| Did Not Have Time |
4.7% |
| Treatment Would Not Help |
2.7% |
| Other Access Barriers |
15.7% |
| Source: SAMHSA, 2004, 2005, and 2006 NSDUHs. |
End Notes
1 Office of Applied Studies. (2007). Results from the 2006 National Survey on Drug Use and Health: National findings (DHHS Publication No. SMA 07-4293, NSDUH Series H-32). Rockville, MD: Substance Abuse and Mental Health Services Administration.
2 Office of Applied Studies. (2007). Table 5.52A. In Results from the 2006 National Survey on Drug Use and Health: Detailed tables. Rockville, MD: Substance Abuse and Mental Health Services Administration. Available at http://samhsa.gov/data/WebOnly.htm#NSDUHtabs
3 NSDUH defines illicit drugs as marijuana/hashish, cocaine (including crack), inhalants, hallucinogens, heroin, or prescription-type drugs used nonmedically. NSDUH measures the nonmedical use of prescription-type pain relievers, sedatives, stimulants, or tranquilizers. Nonmedical use is defined as the use of prescription-type drugs not prescribed for the respondent by a physician or used only for the experience or feeling they caused. Nonmedical use of any prescription-type pain reliever, sedative, stimulant, or tranquilizer does not include over-the-counter drugs. Nonmedical use of stimulants includes methamphetamine use.
4 American Psychiatric Association. (1994). Diagnostic and statistical manual of mental disorders (4th ed.) Washington, DC: Author.
5 Specialty substance use treatment is defined as treatment received at drug or alcohol rehabilitation facilities (inpatient or outpatient), hospitals (inpatient only), and mental health centers. Specialty substance use treatment excludes treatment in an emergency room, private doctor's office, self-help group, prison or jail, or hospital as an outpatient.
6 Number of children under age 18 refers to biological, step, adoptive, or foster children. Missing values were excluded from the analysis for number of children under age 18.
Figure Notes
* Race/ethnicity categories are determined by combining the responses from two separate questions. Respondents identifying themselves as Hispanic were assigned to the Hispanic group regardless of their racial identification. Respondents identifying themselves as non-Hispanic were grouped according to their racial identification. Thus, "white" refers to those identifying themselves as non-Hispanic and white.
** Respondents could indicate multiple reasons; thus, these response categories are not mutually exclusive. Cost/insurance barriers include "no health coverage and could not afford cost," "had health coverage but it did not cover treatment or did not cover cost," and other-specify responses of "could not afford cost; health coverage not indicated." Social stigma includes "might cause neighbors/community to have negative opinion," "might have negative effect on job," "did not want others to find out," and other-specify responses of "ashamed/embarrassed/afraid" and "afraid would have trouble with the police/social services." Did not feel need for treatment/could handle the problem without treatment includes "did not feel need for treatment," "could handle the problem without treatment," and other-specify responses of "could do it with support of family/friends/others" and "could do it through religion/spirituality." Other access barriers include "no transportation/inconvenient," "no program having type of treatment," "no openings in a program," and other-specify responses of "no program had counselors/doctors with whom you were comfortable," "services desired were unavailable or you were currently ineligible," and "attempted to get treatment but encountered delays."
Suggested Citation
Substance Abuse and Mental Health Services Administration, Office of Applied Studies. (October 4, 2007). The NSDUH Report: Substance Use Treatment among Women of Childrearing Age. Rockville, MD.
The National Survey on Drug Use and Health (NSDUH) is an annual survey sponsored by the Substance Abuse and Mental Health Services Administration (SAMHSA). The 2004, 2005, and 2006 data used in this report are based on information obtained from 61,867 women aged 18 to 49. The survey collects data by administering questionnaires to a representative sample of the population through face-to-face interviews at their place of residence.
The NSDUH Report is prepared by the Office of Applied Studies (OAS), SAMHSA, and by RTI International in Research Triangle Park, North Carolina. (RTI International is a trade name of Research Triangle Institute.)
Information on NSDUH used in compiling data for this issue is available in the following publications:
Office of Applied Studies. (2007). Results from the 2006 National Survey on Drug Use and Health: National findings (DHHS Publication No. SMA 07-4293, NSDUH Series H-32). Rockville, MD: Substance Abuse and Mental Health Services Administration.
Office of Applied Studies. (2006). Results from the 2005 National Survey on Drug Use and Health: National findings (DHHS Publication No. SMA 06-4194, NSDUH Series H-30). Rockville, MD: Substance Abuse and Mental Health Services Administration.
Office of Applied Studies. (2005). Results from the 2004 National Survey on Drug Use and Health: National findings (DHHS Publication No. SMA 05-4062, NSDUH Series H-28). Rockville, MD: Substance Abuse and Mental Health Services Administration.
Also available online: http://www.oas.samhsa.gov.
Because of improvements and modifications to the 2002 NSDUH, estimates from the 2002 through 2006 surveys should not be compared with estimates from the 2001 or earlier versions of the survey to examine changes over time.
|
| The NSDUH Report is published periodically by the Office of Applied Studies, Substance Abuse and Mental Health Services Administration (SAMHSA).All material appearing in this report is in the public domain and may be reproduced or copied without permission from SAMHSA. Additional copies of this report or other reports from the Office of Applied Studies are available online: http://www.oas.samhsa.gov. Citation of the source is appreciated. For questions about this report, please e-mail: shortreports@samhsa.hhs.gov. |
|
This page was last updated on March 24, 2009.
|