Science Features
 Loading Page...
The U.S. Geological Survey had a very busy 2011 — below are a few of our highlights from last year.
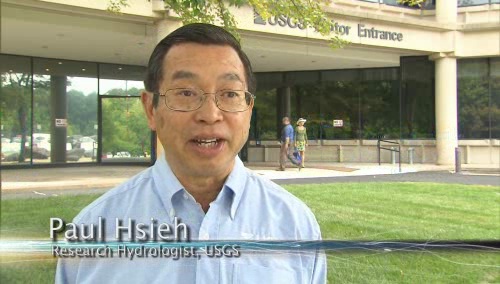
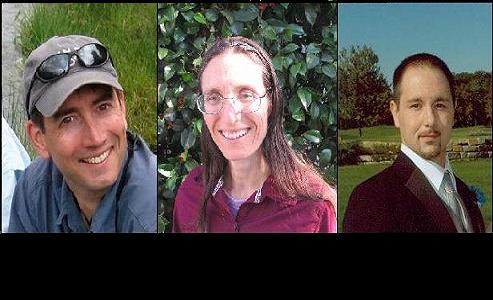
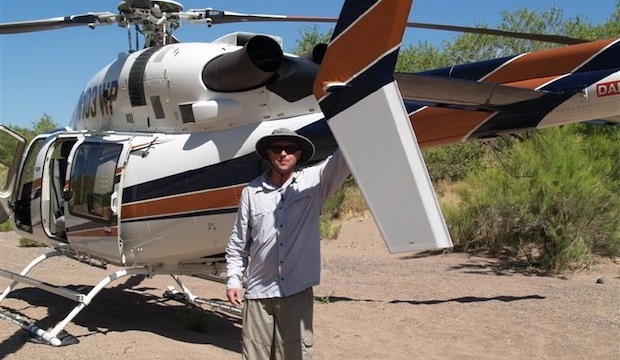
USGS Scientist Paul Hsieh, 2011 Federal Employee of the Year
The USGS scientist Dr. Paul Hsieh was named Federal Employee of the Year, highlighting the value of our science to the Nation. Hsieh was recognized by the Partnership for Public Servicefor his timely scientific analysis that convinced Federal leaders responding to the 2010 Deepwater Horizon oil spill that the cap placed over the Macondo well was working, allowing for a safe shutdown.
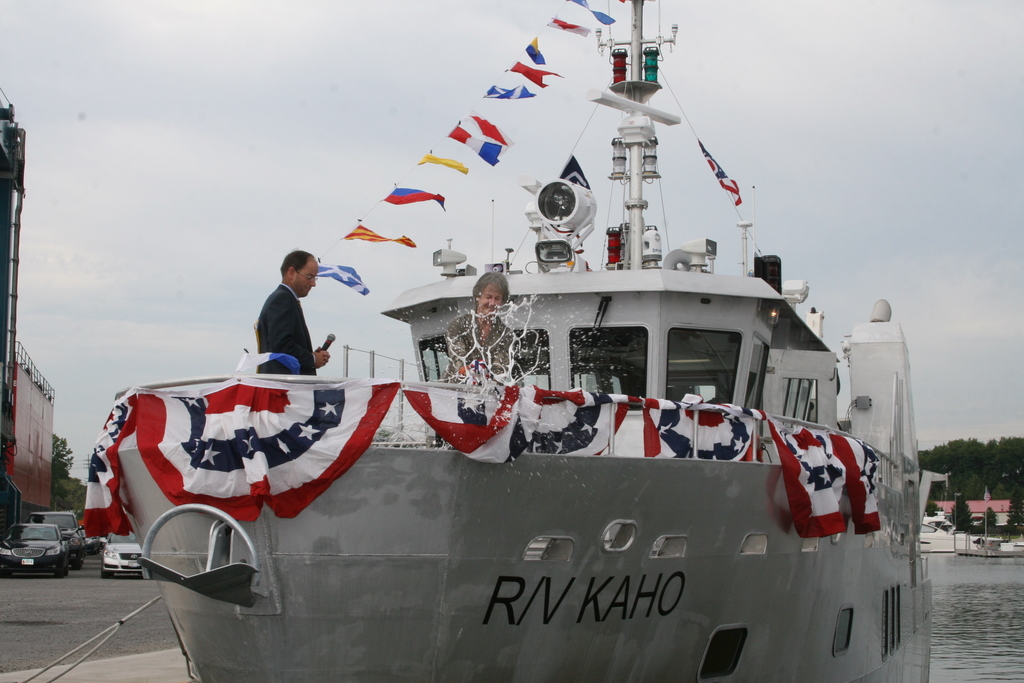
DOI Assistant Secretary Anne Castle Christens the USGS R/V Kaho. The Kaho is one of two sister ships that will begin research work in the Great Lakes.
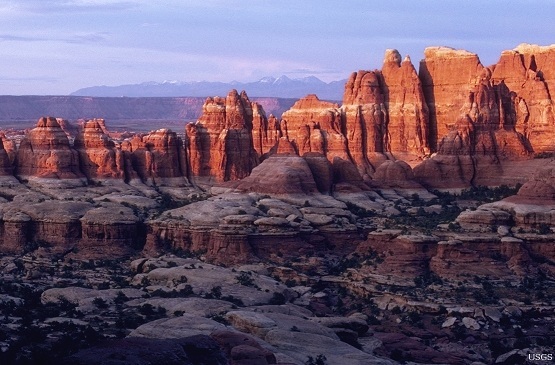
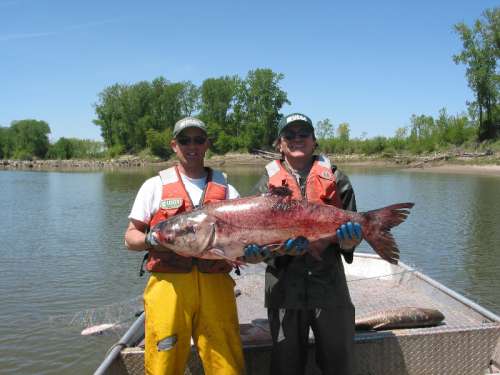
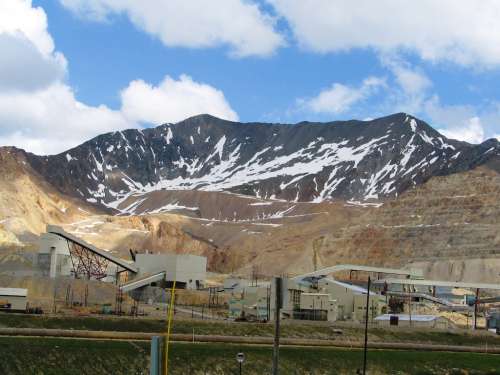
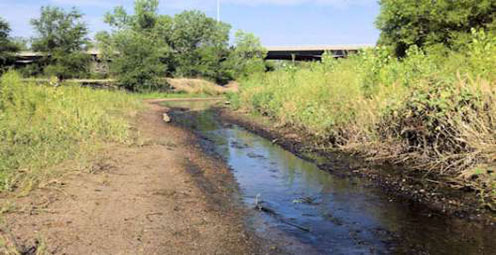
USGS scientists worked on several regional and national issues. We contributed to the Great Lakes Restoration Initiative, including new treatment tools to help control Asian carp, an invasive species, and launch of new research vessels being deployed to understand the deep-water ecosystems and fishes of Lake Erie and Lake Ontario. USGS water quality monitoring and analysis, and water availability monitoring is taking place in waterways across the Nation at seven pilot locations that are part of the Urban Waters Federal Partnership: the Anacostia, Patapsco, Harlem, Bronx, and Los Angeles watersheds; the South Platte River, and the Lake Pontchartrain area. In the Grand Canyon, USGS science on uranium resources, hydrology, and the past impacts of mining informed the decision to withdraw Federal lands around the Grand Canyon from new mining claims. USGS science also played a significant role in Department of the Interior Natural Resource Damage Assessmentsettlements including the Deepwater Horizon oil spill and the Tyrone Mine area in New Mexico.
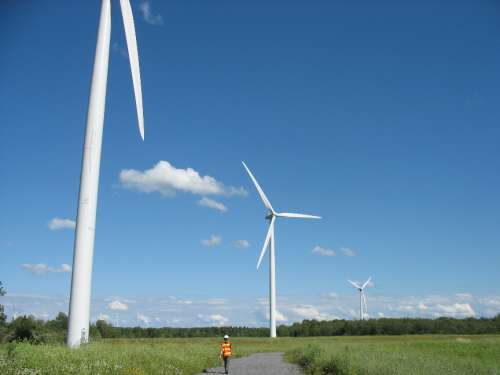
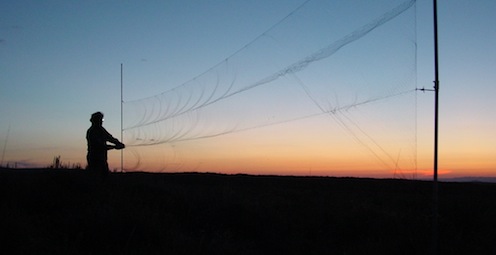
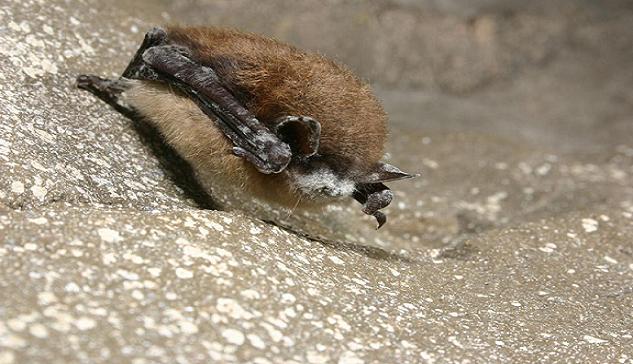
Wind turbines at certain sites in North America each cause dozens of bat fatalities per year.
On the new energy frontier the USGS continues to lead the way in the Department of the Interior with the release of “Wind Energy in the United States and Materials Required for the Land Based Wind Turbine Industry from 2010 Through 2030.” The data suggest that, with the exception of rare earth elements, there should not be a shortage of the principal materials required for electricity generation from wind energy. In the area of wind and wildlife, our scientists are using near-infrared videography to monitor and research bat activity at wind turbines, as a side effect of the expansion of wind energy is increased bird and bat mortality at turbines. We also continue to focus on conventional sources of energy development, evidenced in our summary report of the science needs for conventional energy development for the Chukchi and Beaufort seas. In the area of unconventional gas, the USGS worked with the Department of Energy and provided information for their report on the needed reforms for unconventional gas production, and the USGS is working with the Environmental Protection Agency and DOE on a strategy to fill those research gaps.
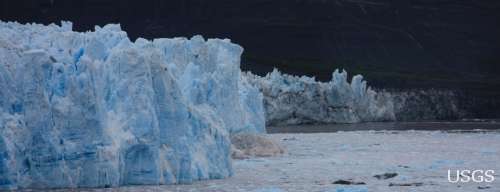
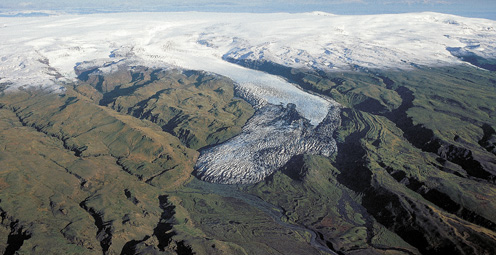
A submarine berg emerges from the advancing terminus of Yahtse Glacier. Iceberg calving is a key process in the global sea level budget.
In the area of climate change, the USGS completed the establishment of the eight climate science centers across the country with universities and consortia in Alaska, Colorado, Massachusetts, Oregon, Hawaii, Oklahoma, North Carolina, and Arizona. We also completed a study measuring the amount of stored carbon in the ecosystems of the Great Plains. This study was the first regional report that applied a comprehensive methodology designed by the USGS in 2010.
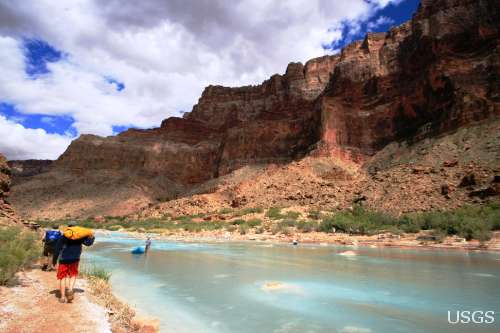
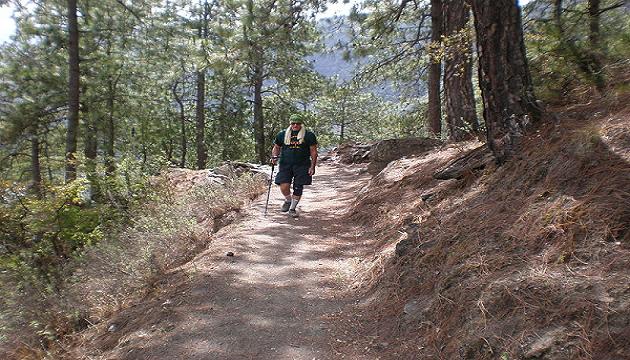
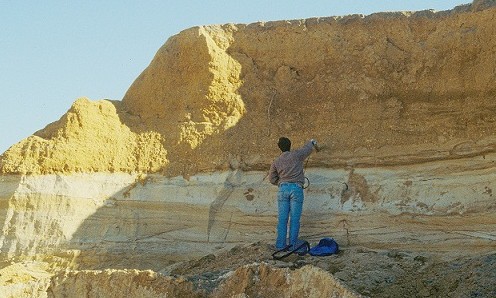
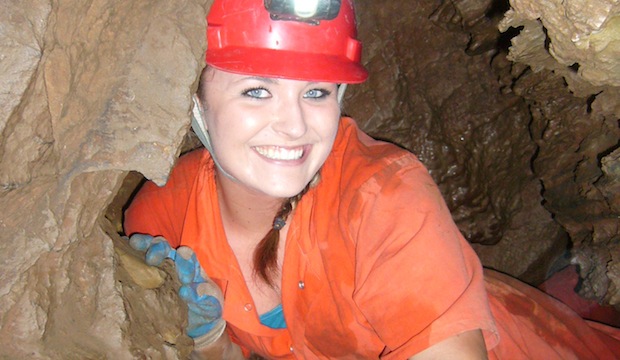
Scientists hike up the Little Colorado River to assist in installing remote PIT tag readers to more efficiently keep track of native, endangered fish populations.
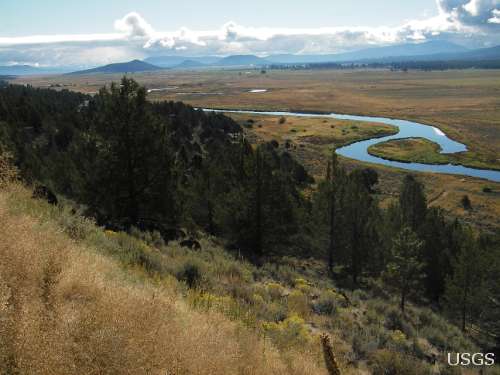
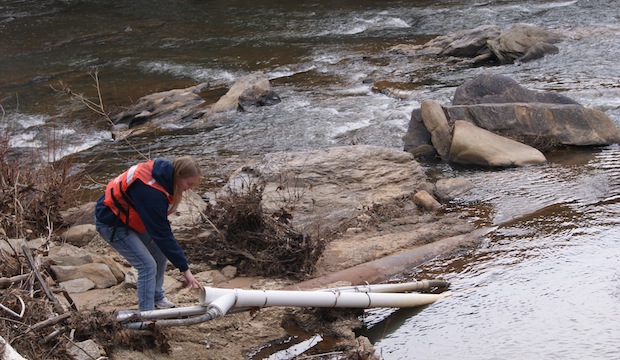
Water continues to be a contentious issue in various parts of the country. In 2011, the USGS launched a geographic focus study on the Colorado River basin, part of the WaterSMART availability and land use assessment, a three-year study that will provide an inventory of water supply and demand. The effort includes assessing water needed to support ecosystems and will report significant competition over water resources and the factors causing the competition. Water information can also be sent to your email inbox or your phone, thanks to WaterAlert. This tool allows users to be notified daily of water levels at any of our 7,600 real-time streamgages across the country. Addressing the Nation’s water resource challenges is a priority for the USGS, and in 2011 we formed an innovative partnership to do just that with the U.S. Army Corps of Engineers and the National Oceanic and Atmospheric Administration. This partnership will provide a one-stop portal to integrated water information for stakeholders with forecasts showing where water for drinking, industry, and ecosystems will be available.
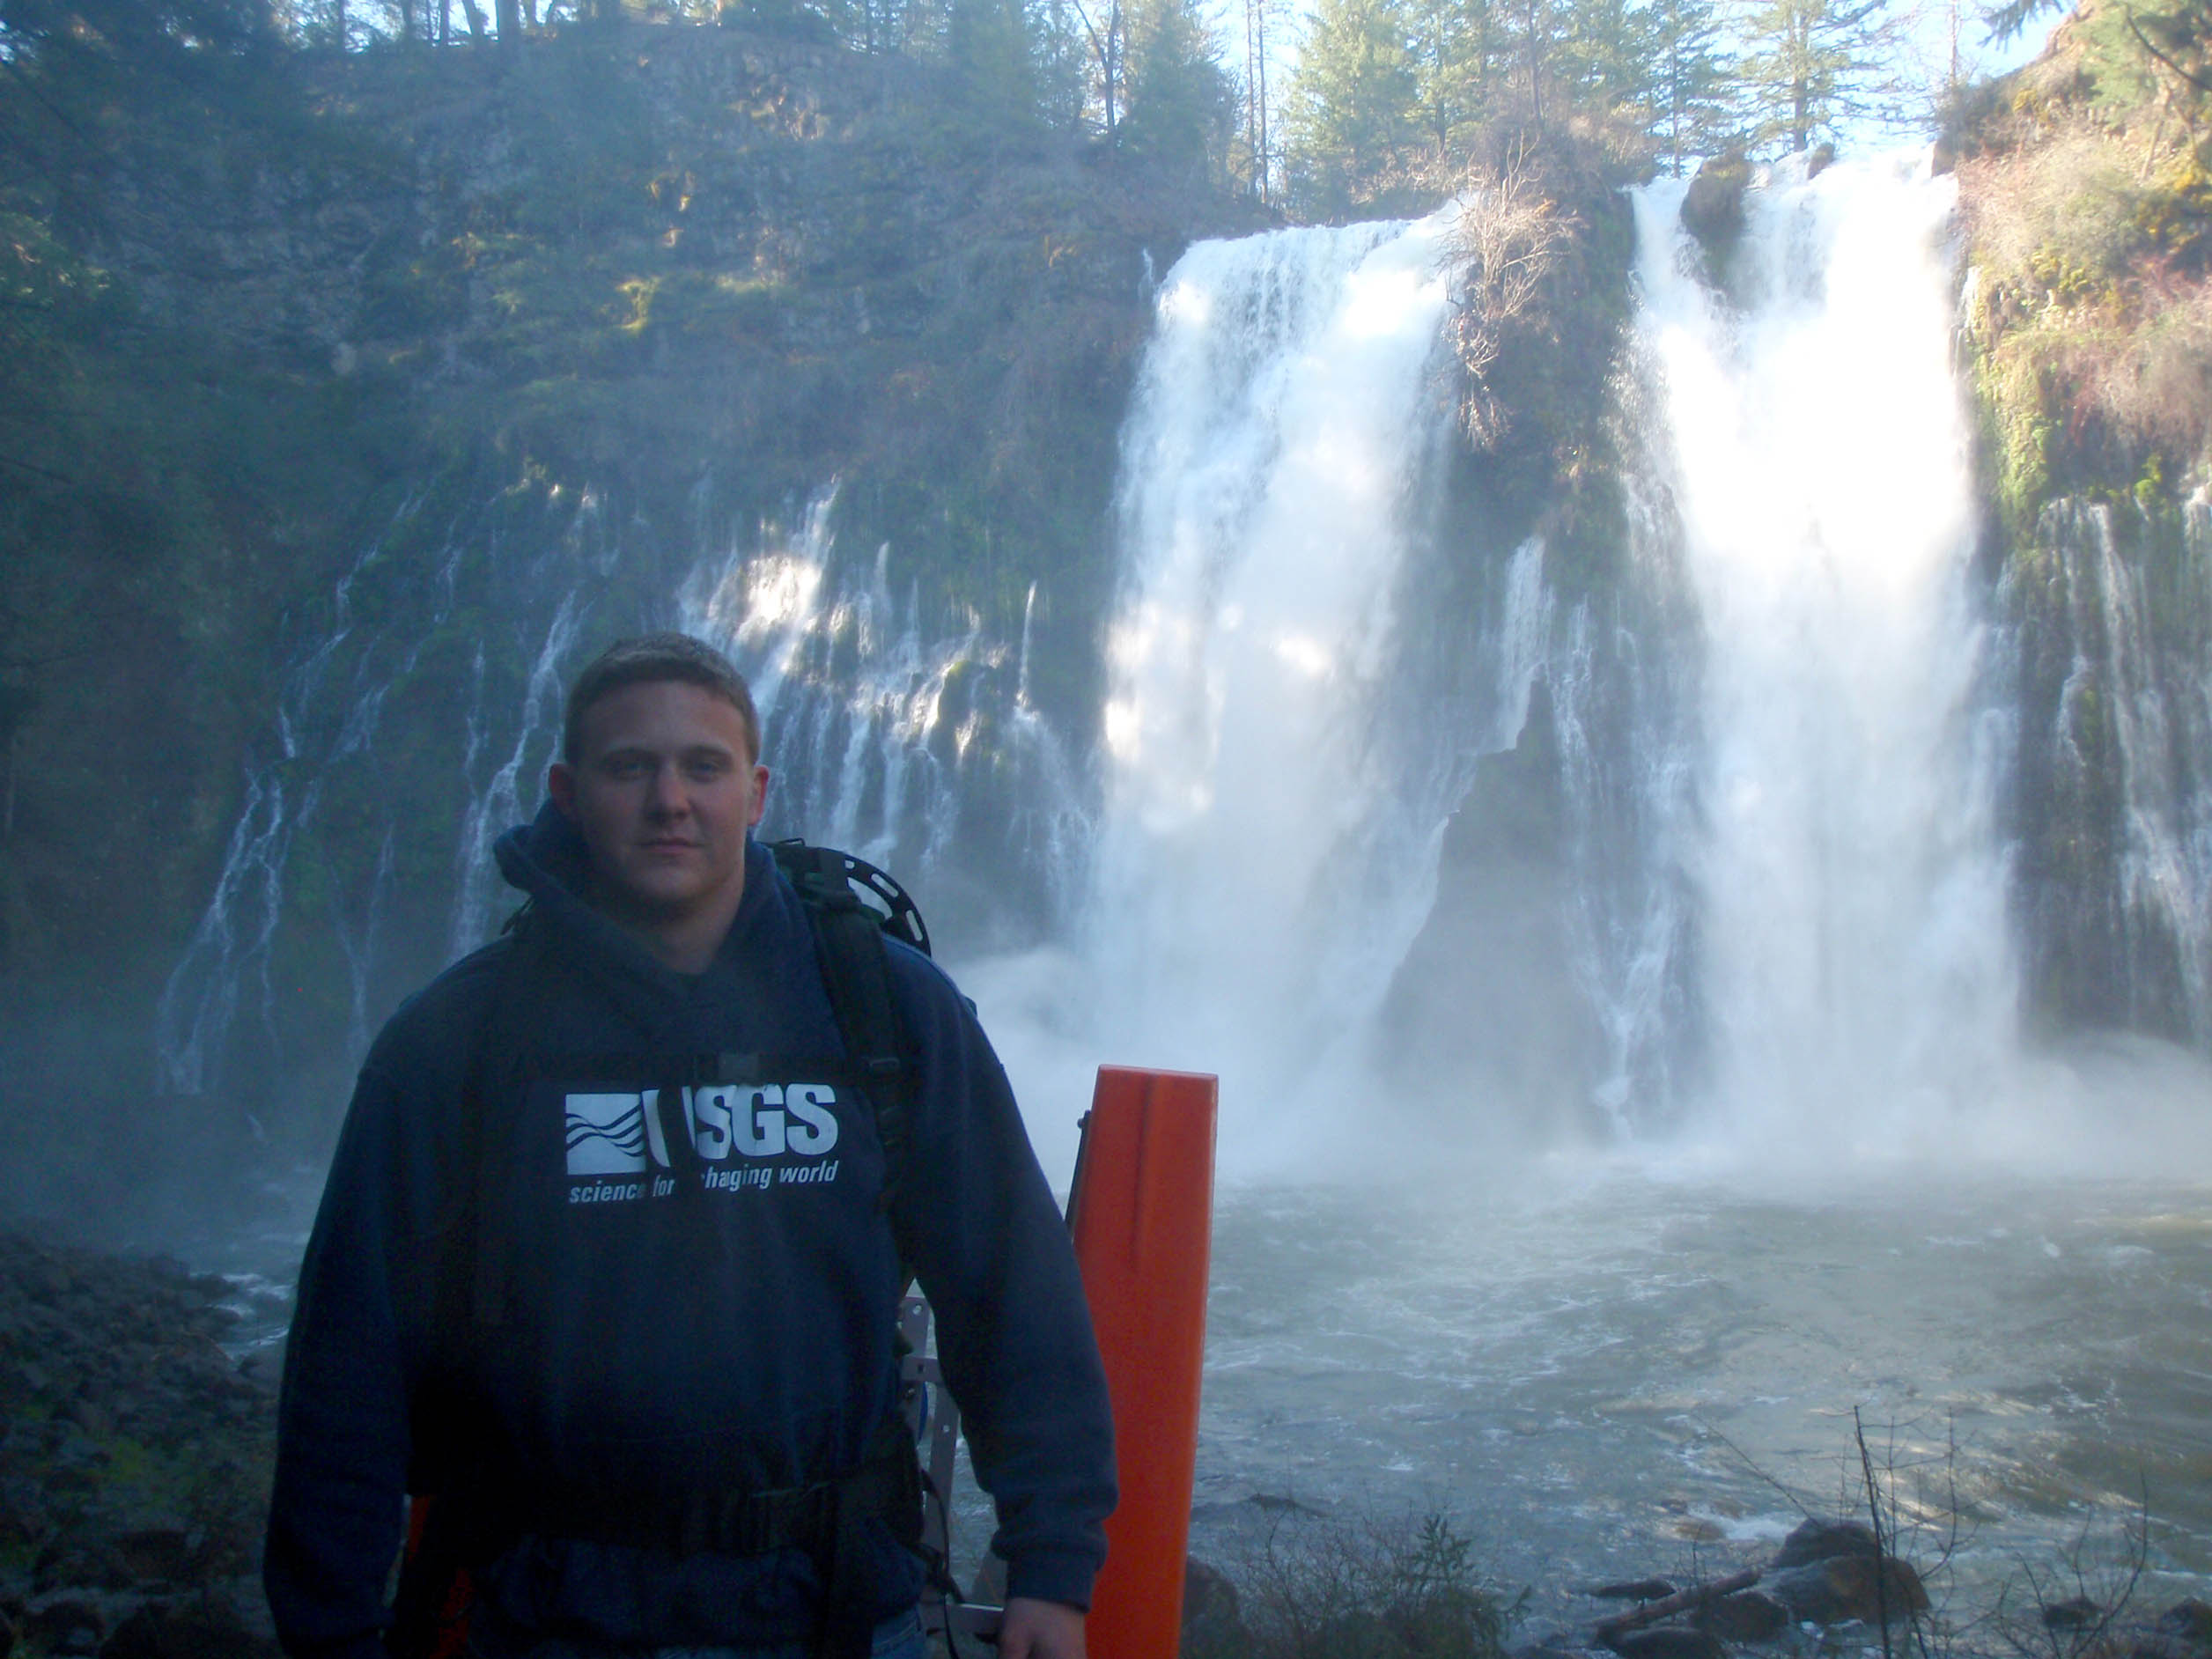
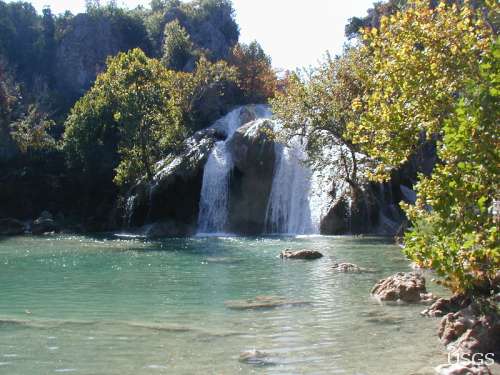
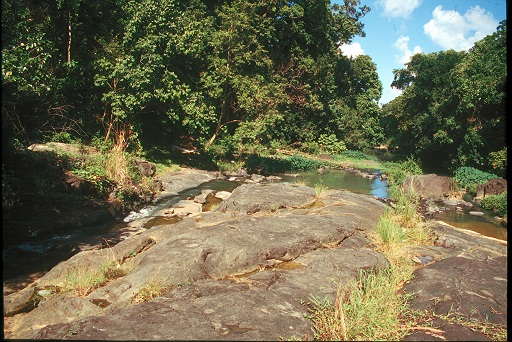
Josh Latimore stands in front of Burney Falls. Latimore started at the USGS as a summer intern and now serves as a USGS hydrologic technician while pursuing his bachelor of science.
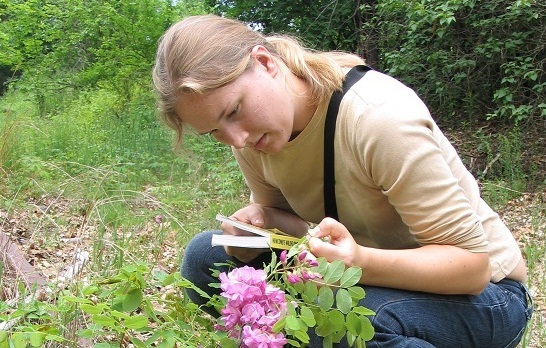
The USGS engaged in a wide array of youth activities nationwide in 2011. From the collaboration with GeoFORCE at the University of Texas-Austin, to the National Cooperative Geologic Mapping Program’s EDMAP training component, to the Rocky Mountain Science and Sustainability Summer Academy (RMSSN). GeoFORCE engages minority high school students in the earth sciences, the EDMAP encourages high school graduates of this program to continue to work with the USGS throughout their college careers, and RMSSN provides training in field observation, data entry, and scientific communication to diverse students.
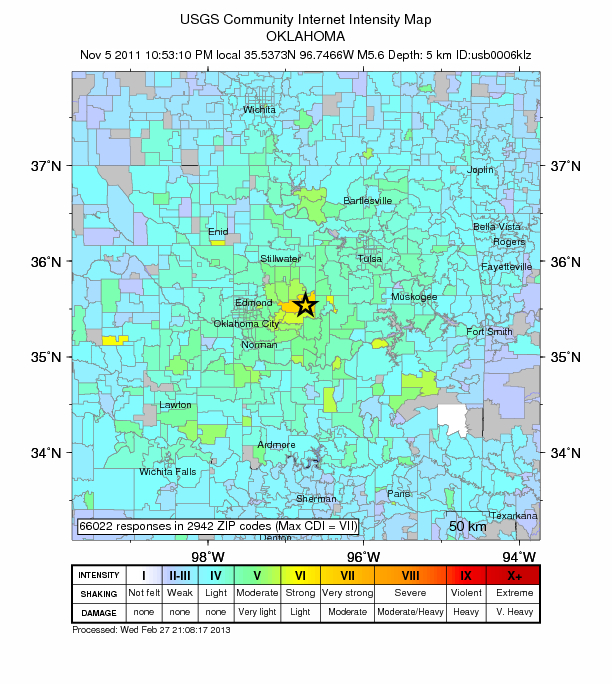
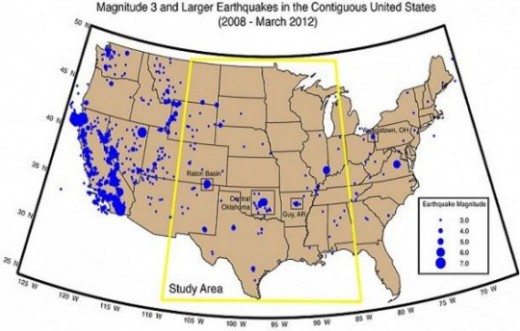
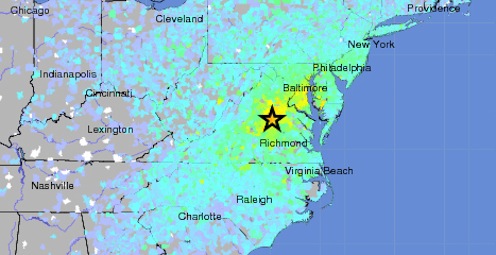
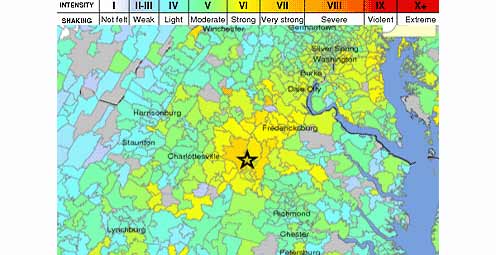
This map shows the various reported levels of shaking around Oklahoma City after the November 5 M5.6 earthquake
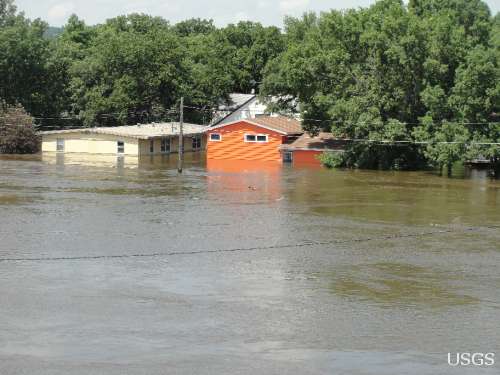
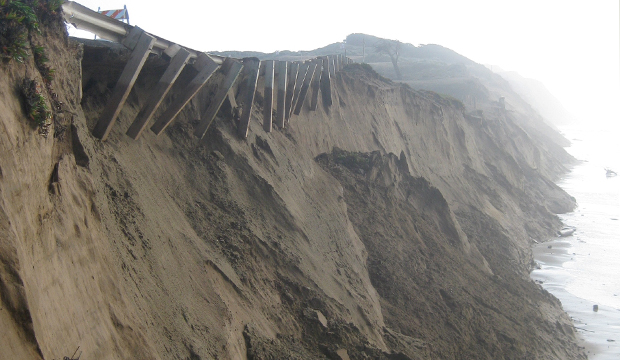
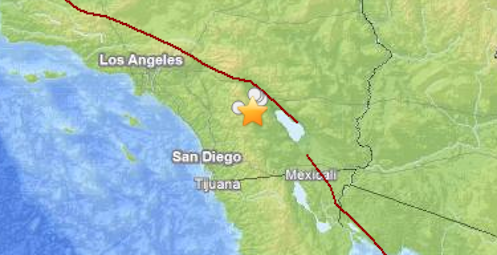
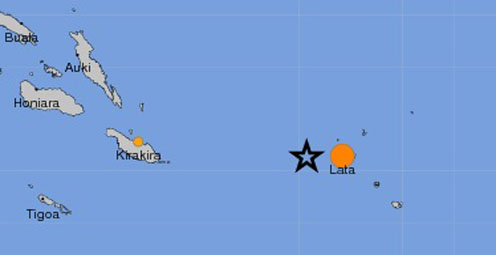
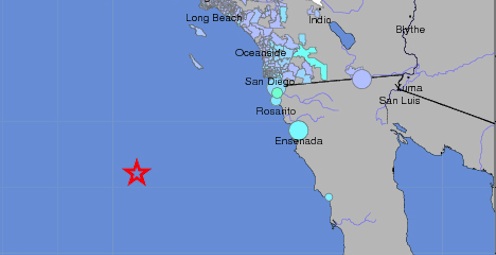
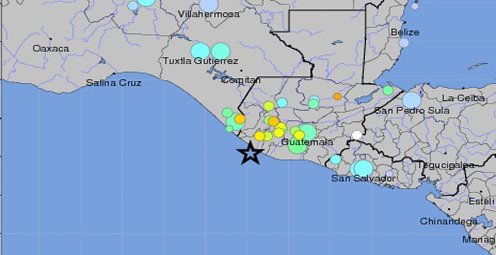
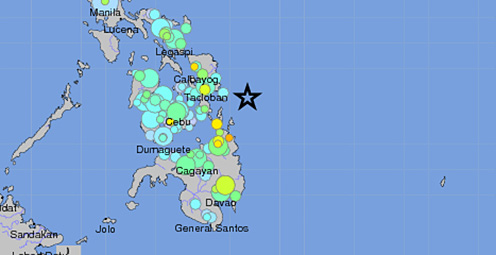
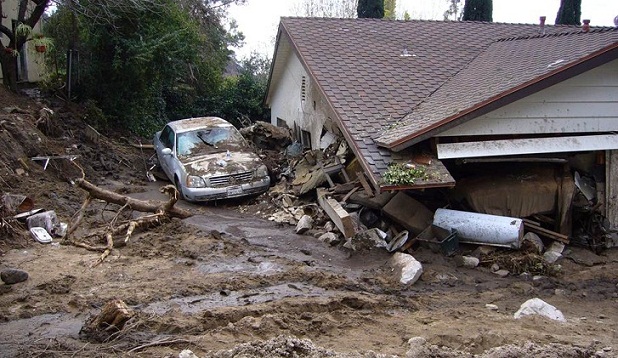
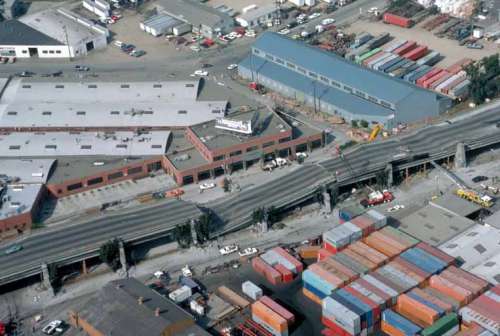
The Great Central U.S. ShakeOut drill, held in April of 2011, is just one example of the USGS’s role in preparing for and responding to natural hazards. Another example is the National Earthquake Information Center’s provision of real-time data to on the magnitude and potential damage of the August earthquake in Virginia, and the November earthquake and aftershocks in Oklahoma. To better monitor aftershocks, mobile seismic monitors were deployed, bringing the total of earthquake sensors in the Advanced National Seismic System to over 2,200. Flooding was also a concern last year, with more than 30 states affected. To educate Congress about the 2011 floods, we conducted a congressional briefing titled “2011 — The Year of the Flood?” For more than 100 years the USGS has played a critical role in reducing flood losses by operating a nationwide streamgage network that monitors the water level and flow of the Nation’s rivers and streams. This information was critical to the Army Corps of Engineers’ decision to simultaneously open the Mississippi River floodgates for the first time.
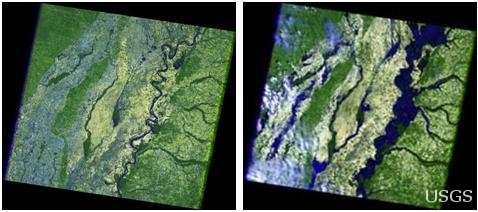
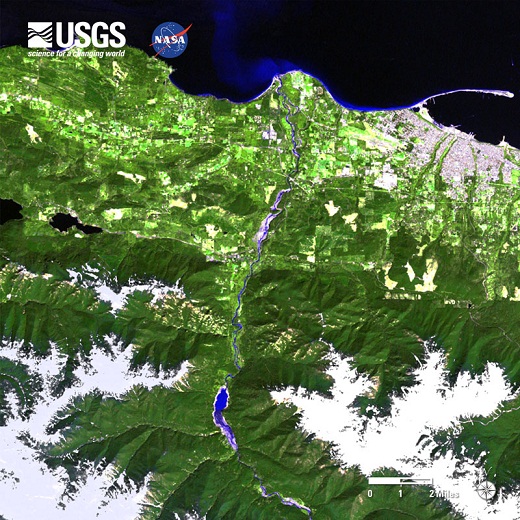
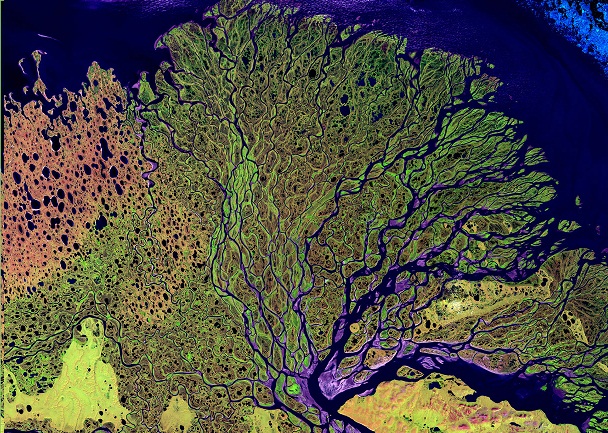
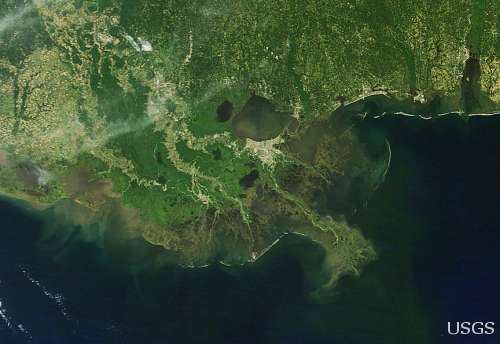
The 2006 image (left) show the river in a more normal state, while the 2011 image (right) shows the massive flooding. The dark blue tones represent water or flooded areas, the light green is cleared fields, and light tones are clouds.
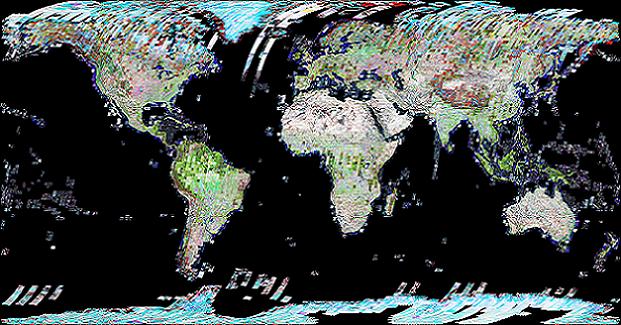
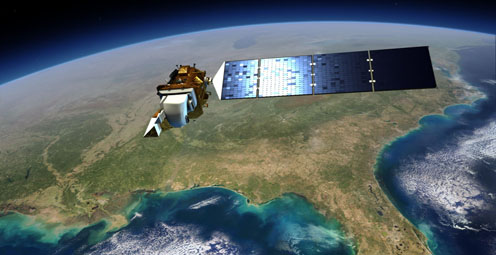
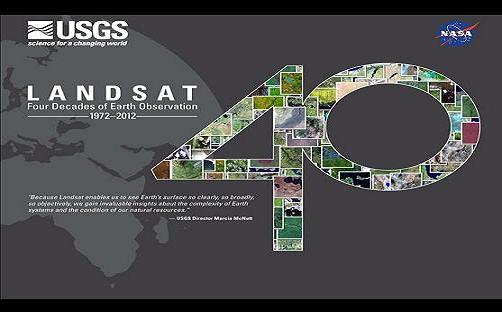
During the heavy flooding that occurred on the Mississippi River, Missouri River, and other major waterways, the USGS’s Landsat satellites produced images of the affected areas to provide an overview of the situation. Landsat has often helped provide a big-picture perspective on natural hazards both domestic and foreign and ranging from tornados to tsunamis to wildfires. Landsat is a joint effort of both USGS and NASA. In addition to imagery of natural hazard events, Landsat provides valuable data for land use research and advances the Department of the Interior’s important role in land remote sensing under the President’s National Space Policy. Landsat images provide complete global coverage, they are available for free, and they span nearly 40 years of continuous earth observation. No other satellite imagery has that combination of attributes. To date, over 6 million scenes have been downloaded; over 2.6 million were downloaded in 2011.
These highlights are but a few of the USGS’s significant accomplishments and activities in 2011. Keep up with what we do in 2012 by visiting www.usgs.gov and following us on Twitter @usgs or on Facebook.
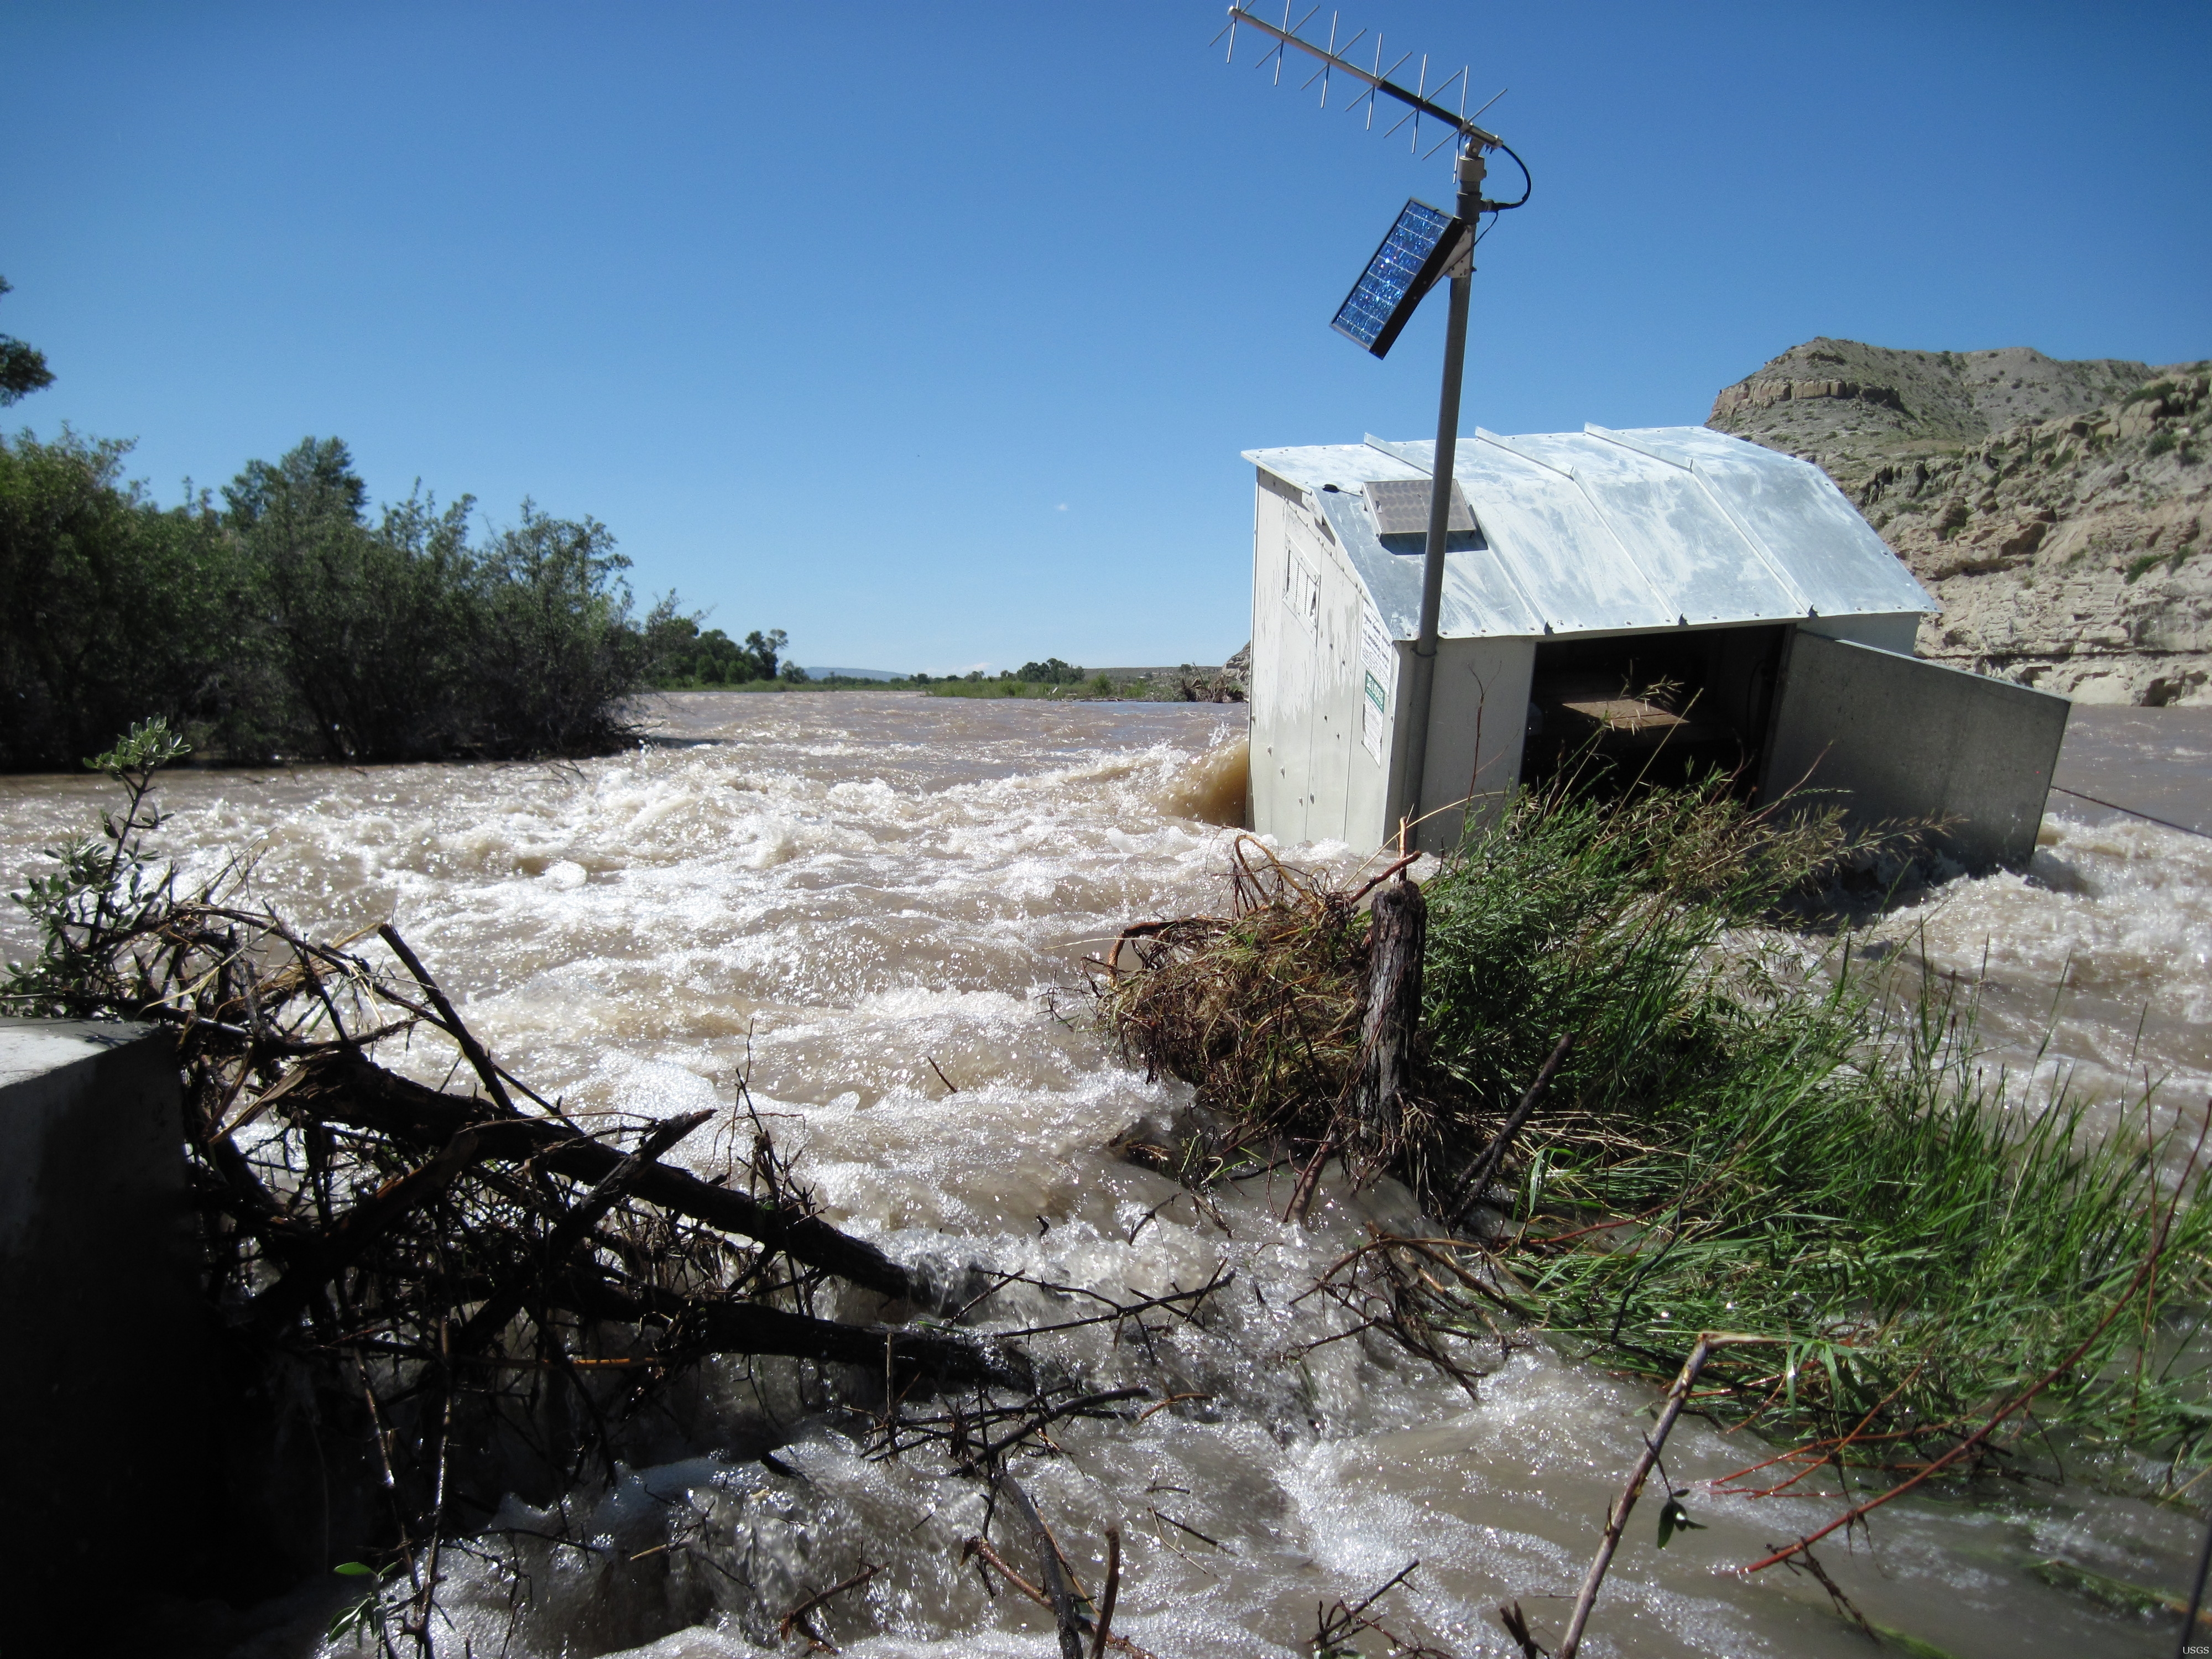
Gagehouse at 06225500 Wind River near Crowheart WY right before it washed away.
On March 3, the U.S. Geological Survey turned 134. Established by Congress in 1879 and built on a legacy of impartial science, the bureau faces unusual challenges in the near term.
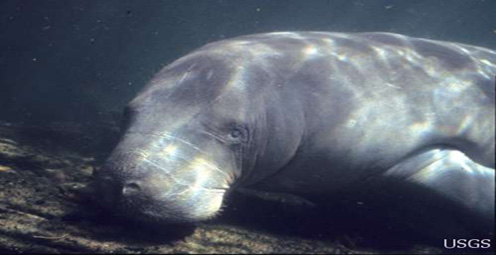
Manatees are often used as sentinels for emerging threats to the ocean environment and human health. Read more
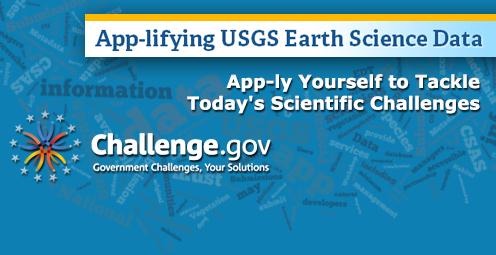
The USGS plans to "app-lify" data with a contest through Challenge.gov. Prizes will be awarded to the best overall app, the best student app, and the people’s choice. Read more
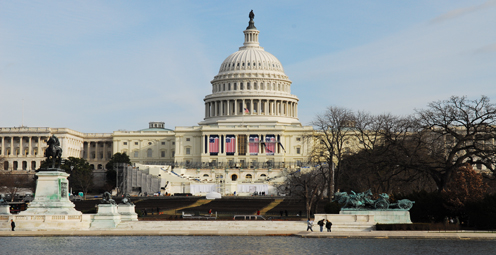
Washington, D.C., is a unique city full of landmarks and buildings that are recognizable worldwide. But how were these stone giants built? Read more
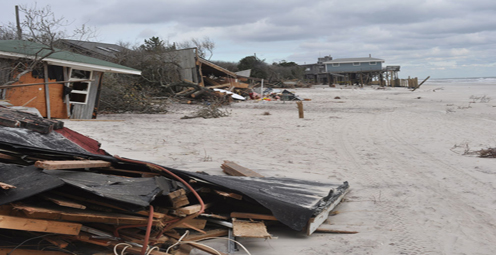
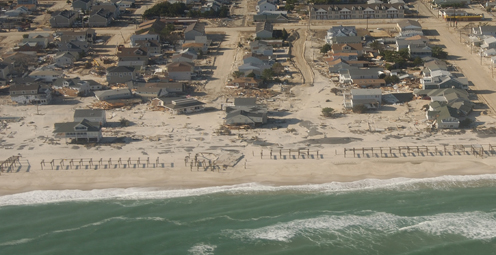
Hurricane Sandy is a stark reminder of just how essential it is for the Nation to become more resilient to coastal hazards.Read more
Please comment on the USGS’ draft science strategies! Read more

Meet Marnelli Taasin, a student trainee working in Administrative Management with the USGS in Hawaii. Read more
Timing is everything! Consider helping track changes in spring’s arrival
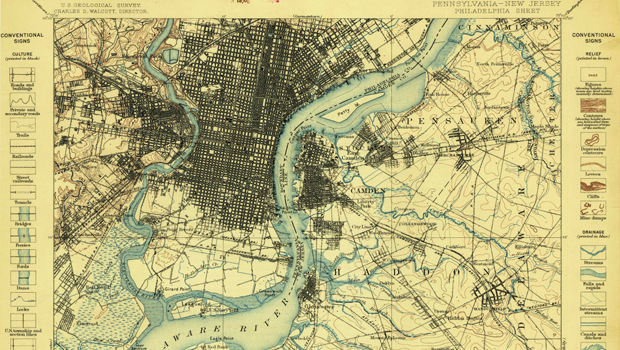
Need a historical map for your genealogy research? You are in luck. We’ve got what you need! Download and view USGS historical maps from the comfort of your own home.
Flood Safety Awareness Week is March. 12-16. What can you do to prepare?
National Groundwater Awareness Week is Mar. 11-17, 2012. See how USGS science is connecting groundwater and surface water.
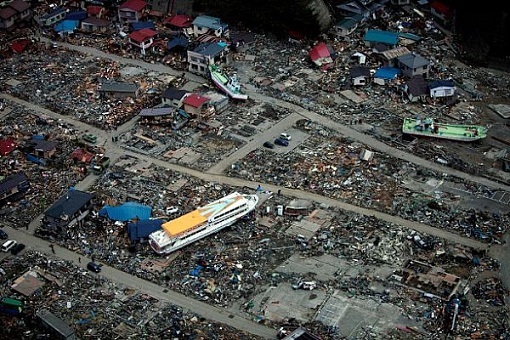
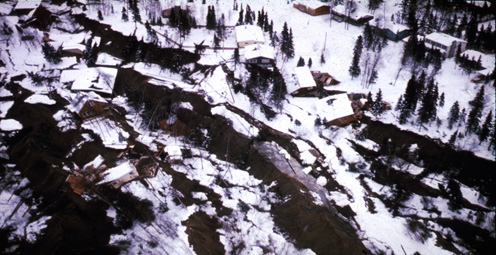
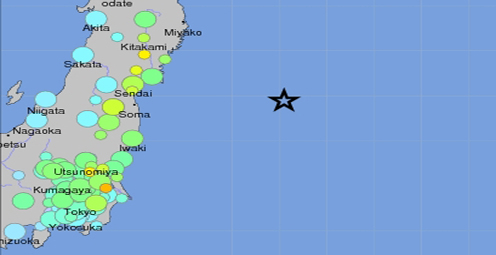
Since Japan’s March 11, 2011, Tohoku earthquake and subsequent tsunami, scientists at the USGS have learned much to help better prepare for a large earthquake in the United States.

Five USGS employees honored with Distinguished Service Awards for their service to the nation
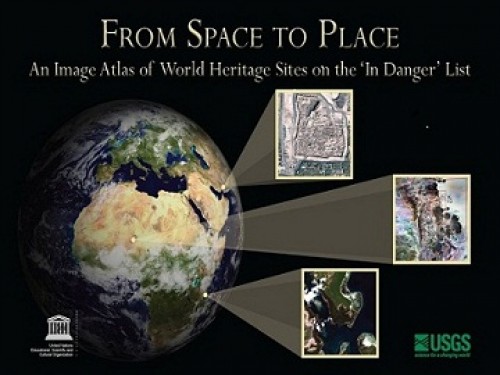
The USGS and UNESCO have produced a book that gives us a new way to look at our shared global heritage.
It’s National Invasive Species Awareness Week. Did you know invasive species cost our country more than 100 billion dollars each year? Get to know America’s ten top invaders this week.
The proposed USGS budget reflects research priorities to respond to nationally relevant issues, including water quantity and quality, ecosystem restoration, hydraulic fracturing, natural disasters such as floods and earthquakes, and support for the National Ocean Policy, and has a large R&D component.
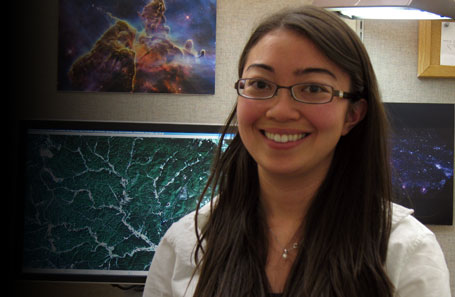
A student geographer shares her experiences and career path with the USGS. Most memorable moment
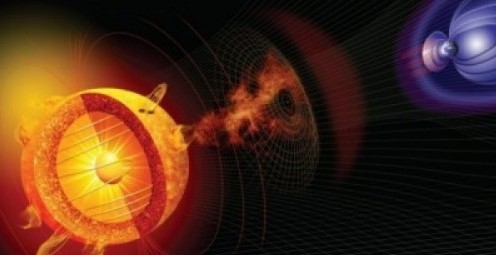
Everyone is familiar with weather systems on earth like rain, wind and snow. But space weather – variable conditions in the space surrounding Earth – has important consequences for our lives inside Earth’s atmosphere.
USGS crews continue to measure streamflow and collect water quality and sediment samples in the Ohio and Mississippi River basins using state-of-art instruments.
Science earns prominent focus in the new Department of the Interior Five-Year Strategic Plan.
http://www.facebook.com/USGeologicalSurvey
On March 3, the U.S. Geological Survey turned 134. Established by Congress in 1879 and built on a legacy of impartial science, the bureau faces unusual challenges in the near term.
Manatees are often used as sentinels for emerging threats to the ocean environment and human health. Read more
The USGS plans to "app-lify" data with a contest through Challenge.gov. Prizes will be awarded to the best overall app, the best student app, and the people’s choice. Read more
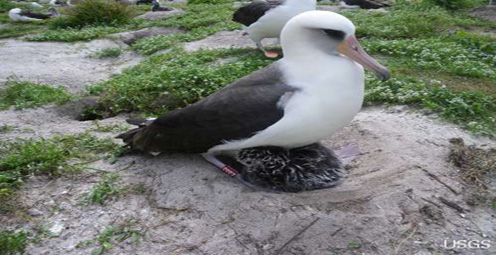
The world’s oldest known wild bird – now 62 – is a mother again. Read more
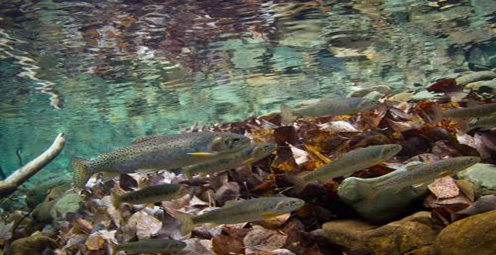
The recent past sheds light on preserving the future of economically and ecologically important native trout populations across the West. Read more
Washington, D.C., is a unique city full of landmarks and buildings that are recognizable worldwide. But how were these stone giants built? Read more
Hurricane Sandy is a stark reminder of just how essential it is for the Nation to become more resilient to coastal hazards.Read more
The 100 million tons of carbon sequestered in western ecosystems each year is an amount equivalent to – and counterbalances the emissions of – more than 83 million U.S. passenger cars a year. Read more
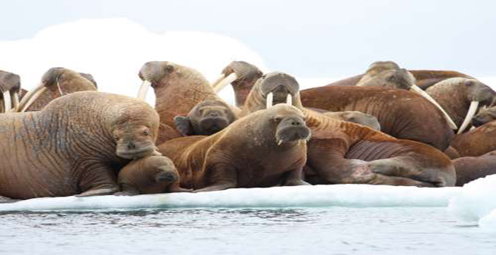
Watch USGS scientists in the Arctic track Pacific walruses to examine how these animals are faring in a world with less sea ice. Read more
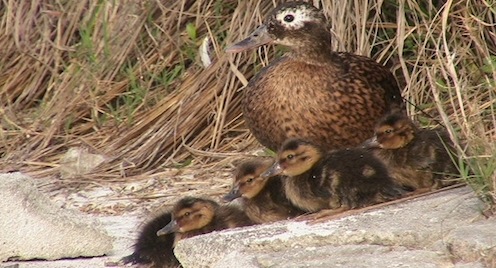
Critically endangered birds whose numbers grew rapidly after successful translocations by USGS and USFWS biologists likely took a hit from the 2011 event. Read more
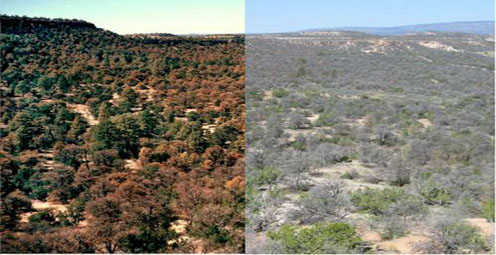
Trees Face Rising Drought Stress and Mortality as Climate Warms. Read more
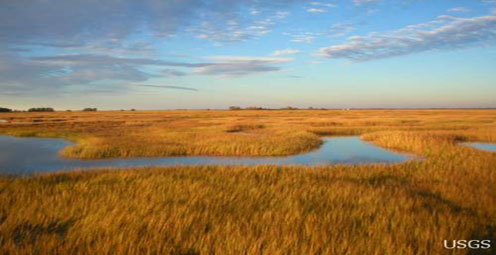
Saltmarshes may slow the rate of climate change. Read more
USGS vigilant for West Nile virus in wildlife through surveillance, research, and mapping.
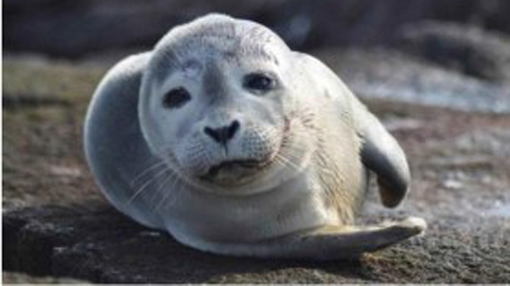
USGS and its partners are investigating the unusual deaths of New England harbor seals. Read more
USGS scientists look to see if water quality is improving. Read more

The majority of the nation is facing dry conditions; in most areas drought conditions are expected to persist or intensify. Read more
After dams tumble down, what happens next? Click here to find out! Read more
Maximizing alternative energy’s potential – how science can help grow the nation’s energy portfolio. Read more
Please comment on the USGS’ draft science strategies! Read more
USGS Details how climate change could affect water availability in 14 U.S. Basins. Read more
Western stream temperatures are not warming at the same rate as air temperature.Read more
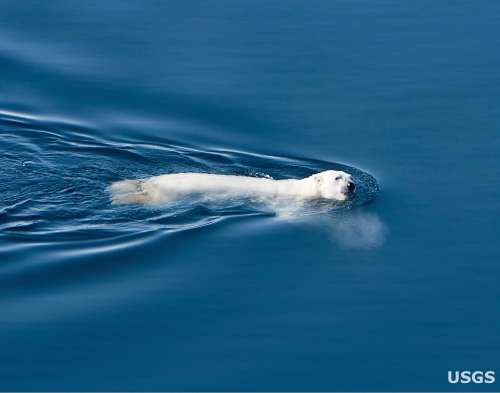
Long polar bear swims provide tantalizing clues.Read more
The larger and more aggressive Eastern species thrives in a threatened species’ forest habitat.
While on your spring hike, beware of hitchhiking ticks—they may carry Lyme Disease.
For the first time since its discovery, White-nose syndrome has been found in the West.

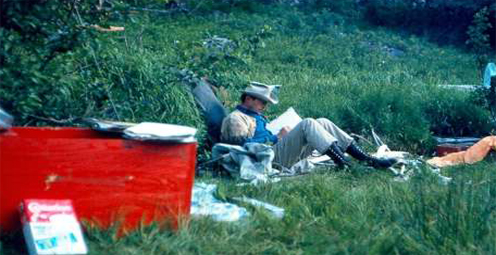
The family picnic: food and fun...until unwanted guests show up! Learn what you can do to prevent West Nile virus from infecting your loved ones.
Timing is everything! Consider helping track changes in spring’s arrival
Flood Safety Awareness Week is March. 12-16. What can you do to prepare?
National Groundwater Awareness Week is Mar. 11-17, 2012. See how USGS science is connecting groundwater and surface water.
Since Japan’s March 11, 2011, Tohoku earthquake and subsequent tsunami, scientists at the USGS have learned much to help better prepare for a large earthquake in the United States.
Five USGS employees honored with Distinguished Service Awards for their service to the nation
It’s National Invasive Species Awareness Week. Did you know invasive species cost our country more than 100 billion dollars each year? Get to know America’s ten top invaders this week.
It’s National Invasive Species Awareness Week. Did you know invasive species cost our country more than 100 billion dollars each year? Get to know America’s ten top invaders this week.
It’s National Invasive Species Awareness Week. Did you know invasive species cost our country more than 100 billion dollars each year? Get to know America’s ten top invaders this week.
It’s National Invasive Species Awareness Week. Did you know invasive species cost our country more than 100 billion dollars each year? Get to know America’s ten top invaders this week.
The proposed USGS budget reflects research priorities to respond to nationally relevant issues, including water quantity and quality, ecosystem restoration, hydraulic fracturing, natural disasters such as floods and earthquakes, and support for the National Ocean Policy, and has a large R&D component.
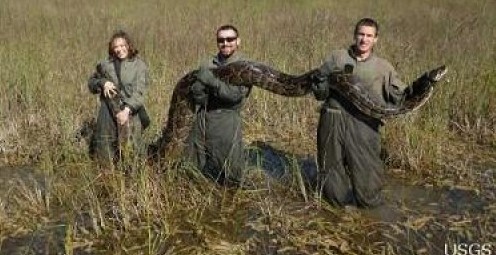
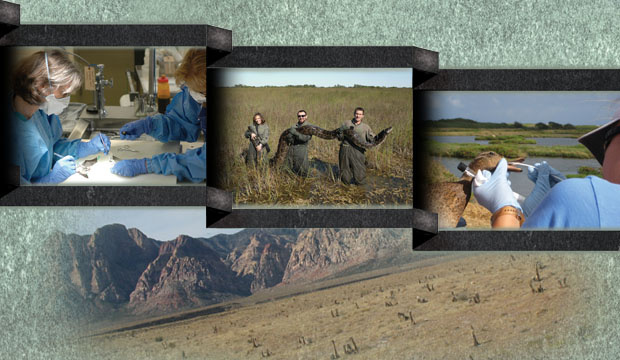
Mid-sized mammals in Everglades National Park are getting a big squeeze from invasive Burmese pythons, according to a USGS co-authored study published in the Proceedings of the National Academy of Sciences.
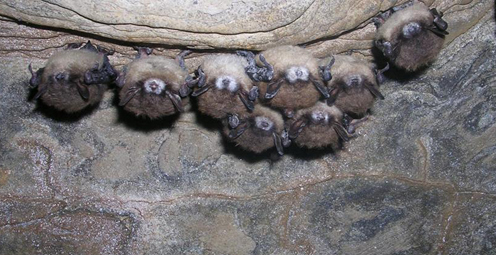
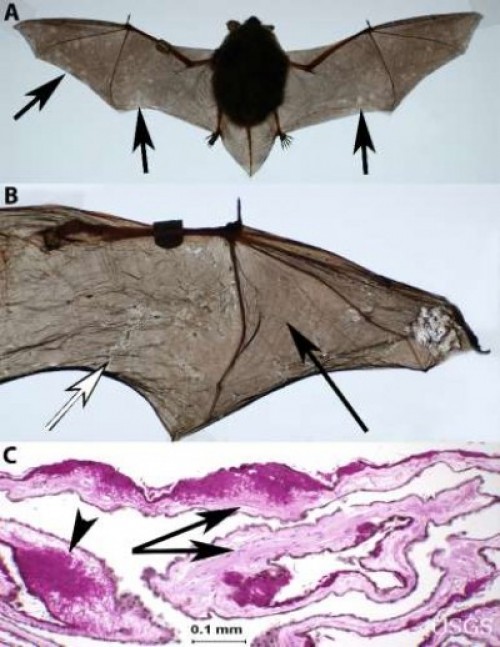
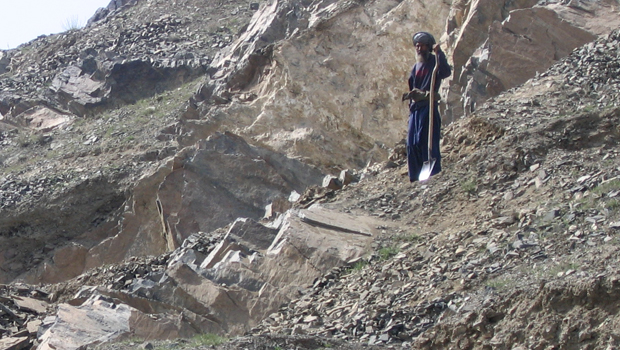
Bat populations, which provide valuable insect control, are declining at an alarming rate due to white-nose syndrome. Scientists have definitively identified the cause of this deadly syndrome.
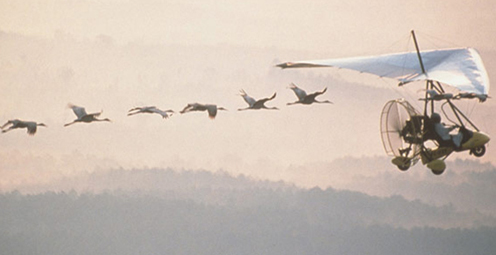
Two adolescent cranes, raised by humans and reintroduced into the wild, were shot and killed. Sadly, they are not the first. How many killed this year? How many are left?
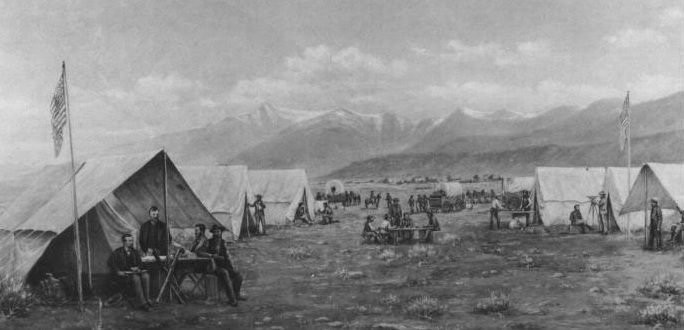
By 1936, devastating losses of wildlife populations were threatening the Nation’s natural resource heritage. America's first wildlife research center
As the team of responders struggled to end the worst oil spill in our Nation’s history, USGS scientist Paul Hsieh provided the critical scientific information needed to make a crucial decision.
The movie Contagion dramatizes the scenario of a global pandemic that begins with the spread of a disease from animals to humans. What are real-life experts doing to prevent a pandemic that originates with wildlife?
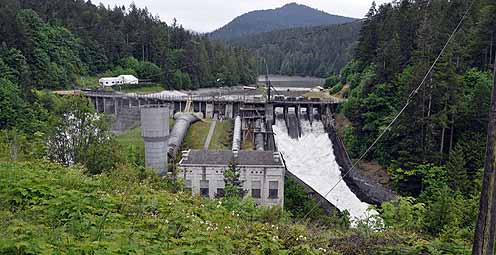
After years of planning, the Department of the Interior has begun removing two dams on the Elwha River in Washington. But how will the removal of these dams impact the river’s sediments, waters, and fish?
As a nation, we use more than 75 billion gallons of groundwater each day. September 13 is the National Groundwater Association’s “Protect Your Groundwater Day.” What we can do to ensure we continue to have enough of it?
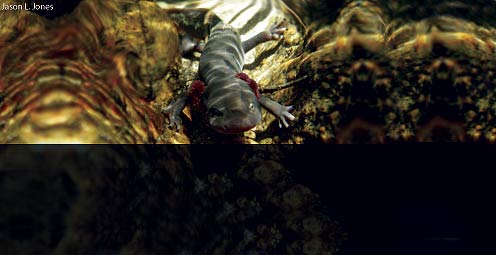
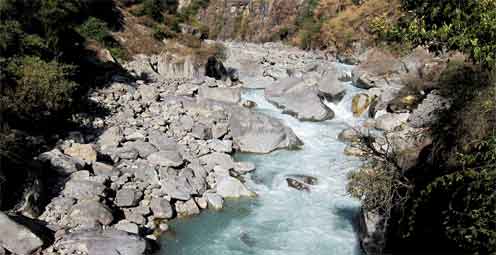
Secretive and rare stream-dwelling amphibians are difficult to find and study. Scientists at the US Geological Survey and University of Idaho have developed a way to detect free-floating DNA from amphibians in fast-moving stream water.
Within the rivers, streams, and lakes of North America live over 200 species of freshwater mussels that share an amazing life history. Join us in Reston, VA to explore the fascinating reproductive biology and ecological role of one of nature’s most sophisticated fishermen.
USGS scientists are working to characterize the contaminants and habitats for a number of aquatic species along the lower Columbia River.
Forests play a significant role in removing carbon from the atmosphere by absorbing one-third of carbon emissions annually. This is according to a new U.S. Forest Service study conducted in collaboration with USGS scientists.
New USGS research shows that rice could become adapted to climate change and some catastrophic events by colonizing its seeds or plants with the spores of tiny naturally occurring fungi. The DNA of the rice plant itself is not changed; instead, researchers are re-creating what normally happens in nature.
A new study supports the ecological reliance of red knots on horseshoe crabs. The well-being of red knots, a declining shorebird species, is directly tied to the abundance of nutrient-rich eggs spawned by horseshoe crabs.
USGS crews continue to measure streamflow and collect water quality and sediment samples in the Ohio and Mississippi River basins using state-of-art instruments.
Native Bees are Selective About Where They Live and Eat -- It's National Pollinator Week, and here's groundbreaking research about the world of our native bees.
As hurricane season starts, researchers are modeling potential changes to coastal environments to identify communities vulnerable to extreme erosion during storms. Data collected before and after storm landfall are used to verify past forecasts and improve future predictions.
Follow the Pacific Nearshore Project as researchers from the USGS, Monterey Bay Aquarium, and other institutions sail Alaskan waters to study sea otters and investigate coastal health.
USGS science supports management, conservation, and restoration of imperiled, at-risk, and endangered species.
New USGS research shows that certain lichens can break down the infectious proteins responsible for chronic wasting disease, a troubling neurological disease fatal to wild deer and elk and spreading throughout the United States and Canada.
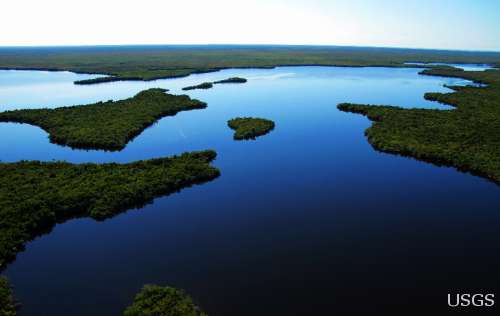
It's time to celebrate the essential role wetlands play in giving us food and water; sheltering us from storms, floods, and coastal erosion; providing habitat for birds, fish, and other wildlife; and cleaning and storing water.
In a unique application of data, this year's report provides the nation's first assessment of birds on public lands and waters.

For reliable information about amphibians and the environmental factors that are important to their management and conservation, visit the new USGS Amphibian Monitoring and Research Initiative website.

A new article explains the economic importance of insect-eating bats to U.S. agriculture and how white-nose syndrome and wind turbines threaten these valuable animals.

Using coral growth records and measurements of changing ocean chemistry from increased atmospheric CO2, USGS scientists are providing a foundation for predicting future impacts of ocean acidification and sea-level rise to coral reefs.

Non-native lionfish are rapidly spreading along the U.S. Eastern seaboard, Gulf of Mexico, and Caribbean and have been preying on and competing with a wide range of native species.

On Midway Island, Wisdom, a 60-year-old albatross, and her chick made it through the tsunami that resulted from the magnitude 9.0 earthquake off of Japan on March 11.
Please answer questions about USGS Ecosystems science.
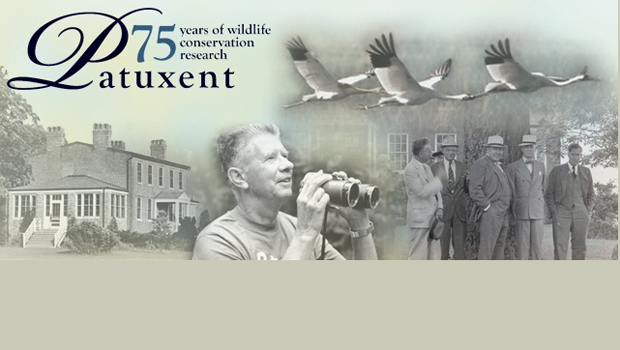
Join us in learning about wildlife conservation research with Dr. Matthew Perry as we celebrate the 75th anniversary of the USGS Patuxent Wildlife Research Center. Major programs include global climate change studies, Chesapeake Bay studies, and wildlife conservation monitoring.
Glen Canyon Dam High-Flow Experiments Provide Insights for Colorado River Management.
Demand for alternative energy sources leads scientists to consider microbes as potential sources of power.
Human health, ecological health, and environmental health are closely connected. Join us to learn how USGS science contributes to our understanding of how such environmental factors affect health threats.
A new identification guide provides images and geographic distributions of diatoms, an important group of algae.
A new USGS video highlights five decades of photographic documented change in coral reef conditions in the Florida Keys.
The USGS National Wildlife Heath Center is working with state agencies in investigating the death of thousands of birds in Arkansas and Louisiana.
Combining traditional ecological knowledge with empirical studies allows the the USGS, Tribal governments, and native organizations to increase their mutual understanding of the current health of Tribal lands and waters.
Scientists have found that the fungus associated with white-nose syndrome in bats is unlike that of any known fungal skin pathogen in land mammals. It is extremely destructive to bats wing skin and may cause catastrophic imbalance in life-support processes.
Sea-ice habitats essential to polar bears would likely respond positively should more curbs be placed on global greenhouse gas emissions, according to a new modeling study published today in the journal, Nature.
Remotely triggered thermal-imagery cameras will be used in a new non-invasive way to study mange in wolves.
Landscape photos taken in the same place but many years apart reveal dramatic changes due to human and natural factors. The USGS Desert Laboratory Repeat Photography Collection, the largest archive of its kind in the world, is 50 years old.
Decreasing pH and warming temperatures are changing ocean conditions and affecting coral and algal growth in South Florida. USGS scientists are conducting field measurements to learn more.
Many coastal wetlands worldwide including several on the U.S. Atlantic coast may be more sensitive than previously thought to climate change and sea-level rise in the this century.
Efforts are underway to restore the Greater Everglades Ecosystem, which has been profoundly altered by development and water management practices. Join us on December 1st when Dr. Lynn Wingard shares USGS research that is helping restoration management agencies develop realistic and attainable restoration goals for the region.
Eight specially trained whooping crane chicks hatched in May have now embarked on their first southward migration, with an ultralight airplane leading them. USGS researchers who hatched, raised, and trained the chicks at the USGS Patuxent Wildlife Research Center, are eagerly following the cranes on their journey.
Beak abnormalities, which make it difficult for birds to feed and clean themselves, are occurring in large numbers of Black-capped Chickadees, Northwestern Crows, and other species in the Pacific Northwest and may signal a growing environmental health problem.
The USGS strongly supports the national celebration of Geography Awareness Week, November 14-20, and this year’s theme: Freshwater. The “where” factor of geography integrates USGS studies in many fields of science.
Two new tools that enable the public to report sick or dead wild animals could also lead to the detection and containment of wildlife disease outbreaks that may pose a health risk to people.
USGS scientists are investigating sea turtles and their habitats in Dry Tortugas National Park to provide insight that will be used as decision-support tools for managing coral ecosystems.
Looking for information on natural resources, natural hazards, geospatial data, and more? The USGS Education site provides great resources, including lessons, data, maps, and more, to support teaching, learning, K-12 education, and university-level inquiry and research.
The Chesapeake Bay has long been an R&R destination for DC residents. However, the watershed’s overpopulation contributes to its decline. Join us when USGS’s Scott Phillips and Peter Claggett discuss new science efforts applied to restoring the Nation's largest estuary on October 6th.
Nutrient sources in both agricultural and urban areas contribute to elevated nutrient concentrations in streams and groundwater across the Nation.
The timing of animal migration and reproduction, and observing when plants send out new leaves and bear fruit, is increasingly important in understanding how climate change affects biological and hydrologic systems. Photo credit Copyright C Brandon Cole.
The USGS has been researching manatees in Florida and the Caribbean for decades, but little is known about Cuban manatees. A USGS biologist recently visited Cuba with a team of international manatee experts working to conserve manatees around the Caribbean.

USGS scientists have discovered a new turtle species, the Pearl River map turtle, found only in the Pearl River in Louisiana and Mississippi. Sea-level changes between glacial and interglacial periods over 10,000 years ago isolated the map turtles, causing them to evolve into unique species.
USGS scientists help land managers determine if fire is the appropriate strategy for controlling or enhancing specific plant species.
Did you know that contaminant-ridden dust from Africa may be harming coral reefs in the Caribbean? Scientists at the USGS are examining the air in Africa and in the Caribbean to determine what kinds of nutrients, microbes, and contaminants are traveling across the ocean.
Pharmaceutical manufacturing facilities can be a significant source of pharmaceuticals in surface water. The USGS is working with water utilities to try to reduce the release of pharmaceuticals and other emerging contaminants to the environment.
The USGS Science Strategy is a comprehensive report to critically examine the USGS's major science goals and priorities for the coming decade. The USGS is moving forward with these strategic science directions in response to the challenges that our Nation's future faces and for the stewards of our Federal lands.
On March 3, the U.S. Geological Survey turned 134. Established by Congress in 1879 and built on a legacy of impartial science, the bureau faces unusual challenges in the near term.
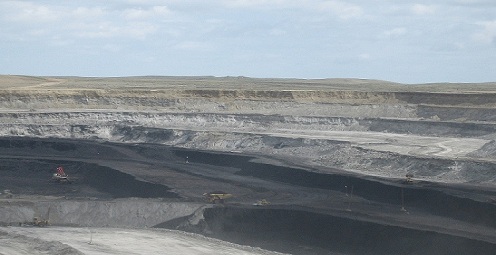
Coal is an important fuel source in the United States today. The USGS has just released a new assessment of coal resources in the Powder River Basin.

A new project in Japan is helping scientists make significant progress in studying gas hydrates as a potential source for natural gas production. Read more
Washington, D.C., is a unique city full of landmarks and buildings that are recognizable worldwide. But how were these stone giants built? Read more
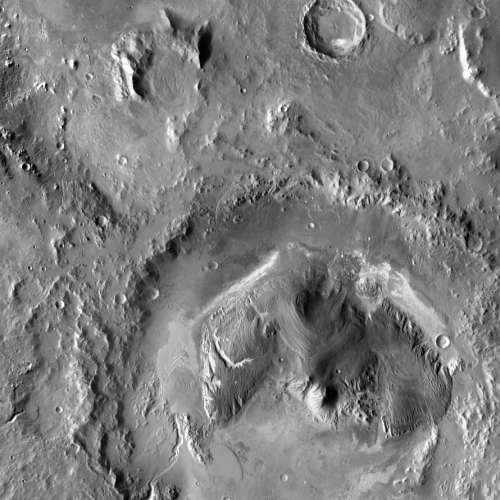
While Curiosity investigates the Red Planet, USGS expertise will help protect the rover from hazards and analyze the data it transmits to Earth. Read more
These 3 young scientists have forged ahead with innovative research at the frontiers of science. Learn more
Maximizing alternative energy’s potential – how science can help grow the nation’s energy portfolio. Read more
Please comment on the USGS’ draft science strategies! Read more
Minerals are elementary to your everyday life, come find out how! Read more
The USGS released a new world estimate for conventional oil and gas resources.
Science or Soundbite? Is the recent increase in midcontinent earthquakes natural or man-made? Find out here.
Timing is everything! Consider helping track changes in spring’s arrival
Flood Safety Awareness Week is March. 12-16. What can you do to prepare?
National Groundwater Awareness Week is Mar. 11-17, 2012. See how USGS science is connecting groundwater and surface water.
Five USGS employees honored with Distinguished Service Awards for their service to the nation
For the first time, the USGS has estimated the potential of undiscovered, technically recoverable oil and gas resources in source rocks of the Alaska North Slope.
The proposed USGS budget reflects research priorities to respond to nationally relevant issues, including water quantity and quality, ecosystem restoration, hydraulic fracturing, natural disasters such as floods and earthquakes, and support for the National Ocean Policy, and has a large R&D component.
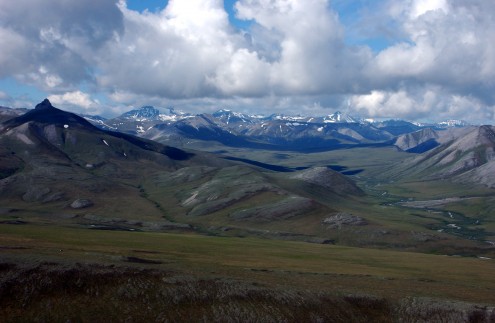
It’s not just the U.S. military working to bring a better future to Afghanistan. How the USGS is helping
As the team of responders struggled to end the worst oil spill in our Nation’s history, USGS scientist Paul Hsieh provided the critical scientific information needed to make a crucial decision.

On September 11, 2001, as the twin towers of the World Trade Center exploded and collapsed, clouds of dust billowed into the sky and across the city.
Now that field work has wrapped up at the Ice Age "Snowmastodon" fossil site near Snowmass Village, Colo., USGS and other scientists will begin work on unraveling the climate and environmental history of the area.
USGS crews continue to measure streamflow and collect water quality and sediment samples in the Ohio and Mississippi River basins using state-of-art instruments.
For over 120 years, USGS has studied and mapped the National Capital region revealing a rich and diverse geologic past. Join us July 6 in Reston, Va., and learn the story of the formation and destruction of continents and oceans, the eruption of ancient volcanoes, climatic and sea level changes, as well as the hazards of modern landslides, earthquakes and karst.
Magnetic storms can cause loss of radio communication, affect global-positioning systems, damage satellite electronics and cause electrical blackouts. USGS scientists are constantly collecting geomagnetic data, and you can view new updates in near-real time.

The most recent earthquake in Japan affected water levels in groundwater wells all over the country. Water level fluctuations were recorded as far away as Illinois, Virginia, Missouri and Florida.

Soluble rock layers called “Karst” exist throughout the nation. While Karst aquifers produce half the nation’s drinking water, rock layers underneath karst dissolve easily sometimes creating sinkholes that threaten life and property. Join us May 4th to learn more about this unseen world beneath our feet.

Early maps of America, documents establishing the provenance of the Hope Diamond and documentation of explorations of the American West-- Join us in discovering the many treasures of the USGS Library.

Please answer questions about USGS Energy & Minerals science.
The need for multiple sources of energy, including the increasing demand for renewable energy, leads USGS scientists to study geothermal energy resources.
Demand for alternative energy sources leads scientists to consider microbes as potential sources of power.
Looking for information on natural resources, natural hazards, geospatial data, and more? The USGS Education site provides great resources, including lessons, data, maps, and more, to support teaching, learning, K-12 education, and university-level inquiry and research.
The USGS PAGER system (Prompt Assessment of Global Earthquakes for Response) will now include estimated economic loss and casualty information. This system is used by emergency responders, government and aid officials, and the public to understand the scope of the disaster to develop the best response.
USGS is playing a critical role in the federal government's coordinated Deepwater Horizon response efforts.
The USGS Science Strategy is a comprehensive report to critically examine the USGS's major science goals and priorities for the coming decade. The USGS is moving forward with these strategic science directions in response to the challenges that our Nation's future faces and for the stewards of our Federal lands.
On March 3, the U.S. Geological Survey turned 134. Established by Congress in 1879 and built on a legacy of impartial science, the bureau faces unusual challenges in the near term.
Washington, D.C., is a unique city full of landmarks and buildings that are recognizable worldwide. But how were these stone giants built? Read more
Hurricane Sandy is a stark reminder of just how essential it is for the Nation to become more resilient to coastal hazards.Read more
As Halloween approaches and hibernation nears, these animals of the night sky face an uncertain future. Read more
USGS vigilant for West Nile virus in wildlife through surveillance, research, and mapping.
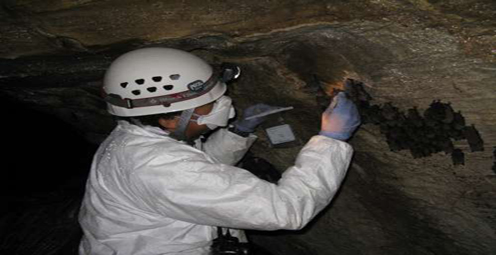
Dust storms July 21-22 blinded motorists, grounded flights and knocked out electricity. What’s causing the dust storms?
Please comment on the USGS’ draft science strategies! Read more
While on your spring hike, beware of hitchhiking ticks—they may carry Lyme Disease.
For the first time since its discovery, White-nose syndrome has been found in the West.
The family picnic: food and fun...until unwanted guests show up! Learn what you can do to prevent West Nile virus from infecting your loved ones.
Timing is everything! Consider helping track changes in spring’s arrival
Flood Safety Awareness Week is March. 12-16. What can you do to prepare?
National Groundwater Awareness Week is Mar. 11-17, 2012. See how USGS science is connecting groundwater and surface water.
Since Japan’s March 11, 2011, Tohoku earthquake and subsequent tsunami, scientists at the USGS have learned much to help better prepare for a large earthquake in the United States.
Five USGS employees honored with Distinguished Service Awards for their service to the nation
It’s National Invasive Species Awareness Week. Did you know invasive species cost our country more than 100 billion dollars each year? Get to know America’s ten top invaders this week.
Groundwater in aquifers on the East Coast and in the Central U.S. has the highest risk of contamination from radium, a naturally occurring radioactive element and known carcinogen.
The proposed USGS budget reflects research priorities to respond to nationally relevant issues, including water quantity and quality, ecosystem restoration, hydraulic fracturing, natural disasters such as floods and earthquakes, and support for the National Ocean Policy, and has a large R&D component.
Four new reports examine the contaminants polycyclic aromatic hydrocarbons (PAHs) found in house dust, streams, lakes, soil, and air.
Climate science is helping to predict food shortages, identify impacts on human health, and prepare for future conditions.
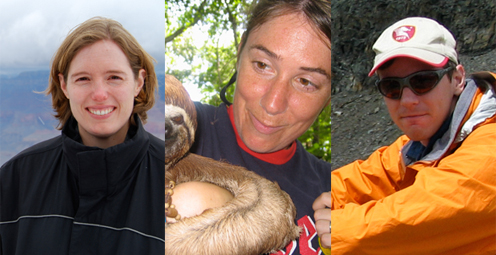
It's only the beginning of their careers, but these 3 young scientists have forged ahead with innovative research at the frontiers of science. How they've transformed their fields
Oct. 9-15, 2011, is Earth Science Week, themed "Our-Ever Changing Earth," and Oct. 12, 2011, is International Day for Natural Disaster Reduction. Answers to questions posed by a changing world
By 1936, devastating losses of wildlife populations were threatening the Nation’s natural resource heritage. America's first wildlife research center

A dust storm on Tuesday, October 4, blinded motorists and caused a large string of motor vehicle crashes, multiple injuries, and at least one death. What’s causing the dust storms?
As the team of responders struggled to end the worst oil spill in our Nation’s history, USGS scientist Paul Hsieh provided the critical scientific information needed to make a crucial decision.
The movie Contagion dramatizes the scenario of a global pandemic that begins with the spread of a disease from animals to humans. What are real-life experts doing to prevent a pandemic that originates with wildlife?
On September 11, 2001, as the twin towers of the World Trade Center exploded and collapsed, clouds of dust billowed into the sky and across the city.
Forests play a significant role in removing carbon from the atmosphere by absorbing one-third of carbon emissions annually. This is according to a new U.S. Forest Service study conducted in collaboration with USGS scientists.
USGS crews continue to measure streamflow and collect water quality and sediment samples in the Ohio and Mississippi River basins using state-of-art instruments.
Ten gangly, adolescent whooping cranes have been released in Louisiana, marking a milestone for the USGS, the State of Louisiana, and the whooping cranes. The USGS has the largest breeding flock in the U.S., at about 60 birds. About half of these USGS-raised birds are returned to the wild each year.
Human health, ecological health, and environmental health are closely connected. Join us to learn how USGS science contributes to our understanding of how such environmental factors affect health threats.
Looking for information on natural resources, natural hazards, geospatial data, and more? The USGS Education site provides great resources, including lessons, data, maps, and more, to support teaching, learning, K-12 education, and university-level inquiry and research.
The Chesapeake Bay has long been an R&R destination for DC residents. However, the watershed’s overpopulation contributes to its decline. Join us when USGS’s Scott Phillips and Peter Claggett discuss new science efforts applied to restoring the Nation's largest estuary on October 6th.
USGS scientists help land managers determine if fire is the appropriate strategy for controlling or enhancing specific plant species.
Pharmaceutical manufacturing facilities can be a significant source of pharmaceuticals in surface water. The USGS is working with water utilities to try to reduce the release of pharmaceuticals and other emerging contaminants to the environment.
The United States Group on Earth Observations (USGEO) is working to connect Earth observations with public health, agriculture, climate, and data management and dissemination.
The USGS Science Strategy is a comprehensive report to critically examine the USGS's major science goals and priorities for the coming decade. The USGS is moving forward with these strategic science directions in response to the challenges that our Nation's future faces and for the stewards of our Federal lands.
On March 3, the U.S. Geological Survey turned 134. Established by Congress in 1879 and built on a legacy of impartial science, the bureau faces unusual challenges in the near term.
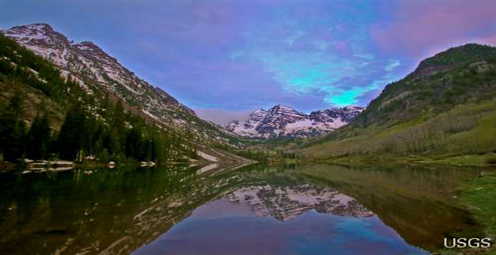
The extent and distribution of the world’s ice, primarily in the form of glaciers, provide insight about changes in the Earth’s climate and changes in sea-level. Read more
The Nation’s next Earth-observing satellite was successfully launched on February 11. Once it is mission-certified in orbit, the satellite will become Landsat 8. Read more
The recent past sheds light on preserving the future of economically and ecologically important native trout populations across the West. Read more
Washington, D.C., is a unique city full of landmarks and buildings that are recognizable worldwide. But how were these stone giants built? Read more
Watch USGS scientists in the Arctic track Pacific walruses to examine how these animals are faring in a world with less sea ice. Read more
The world's longest-running Earth-observing satellite program.
Dust storms July 21-22 blinded motorists, grounded flights and knocked out electricity. What’s causing the dust storms?
The majority of the nation is facing dry conditions; in most areas drought conditions are expected to persist or intensify. Read more
A contest to celebrate 40 years of Landsat. Read more
Please comment on the USGS’ draft science strategies! Read more
Timing is everything! Consider helping track changes in spring’s arrival
Need a historical map for your genealogy research? You are in luck. We’ve got what you need! Download and view USGS historical maps from the comfort of your own home.
Flood Safety Awareness Week is March. 12-16. What can you do to prepare?
National Groundwater Awareness Week is Mar. 11-17, 2012. See how USGS science is connecting groundwater and surface water.
Since Japan’s March 11, 2011, Tohoku earthquake and subsequent tsunami, scientists at the USGS have learned much to help better prepare for a large earthquake in the United States.
Five USGS employees honored with Distinguished Service Awards for their service to the nation
The USGS and UNESCO have produced a book that gives us a new way to look at our shared global heritage.
Groundwater in aquifers on the East Coast and in the Central U.S. has the highest risk of contamination from radium, a naturally occurring radioactive element and known carcinogen.
The proposed USGS budget reflects research priorities to respond to nationally relevant issues, including water quantity and quality, ecosystem restoration, hydraulic fracturing, natural disasters such as floods and earthquakes, and support for the National Ocean Policy, and has a large R&D component.
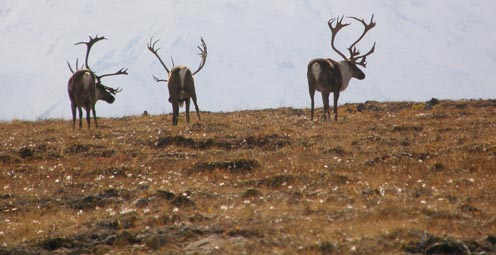
Caribou expert Layne Adams discusses the lives of reindeer — apart from their famous role on Christmas Eve. How they survive the cold.
Climate science is helping to predict food shortages, identify impacts on human health, and prepare for future conditions.
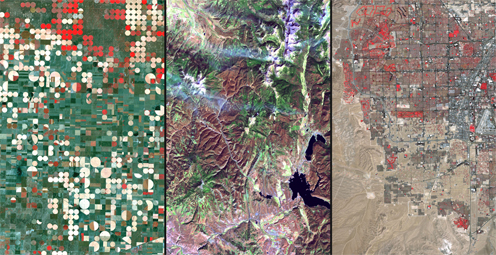
As demand grows, Landsat data can help us track trends in key resources. Remote-sensing satellites help scientists to observe our world, monitor changes, and detect critical trends in forestry, water, crops, and urban landscapes. Learn more.
A new study provides crucial information for difficult decisions regarding conservation, economic interests, and food and water security. Projected changes for 2010-2099
It's only the beginning of their careers, but these 3 young scientists have forged ahead with innovative research at the frontiers of science. How they've transformed their fields
Oct. 9-15, 2011, is Earth Science Week, themed "Our-Ever Changing Earth," and Oct. 12, 2011, is International Day for Natural Disaster Reduction. Answers to questions posed by a changing world
By 1936, devastating losses of wildlife populations were threatening the Nation’s natural resource heritage. America's first wildlife research center
A dust storm on Tuesday, October 4, blinded motorists and caused a large string of motor vehicle crashes, multiple injuries, and at least one death. What’s causing the dust storms?
USGS scientists study walruses off the northwestern Alaska coast in August as part of their ongoing study of how the Pacific walrus are responding to reduced sea ice conditions in late summer and fall.
USGS scientists are collecting water samples and other data to determine trends in ocean acidification from the least explored ocean in the world.
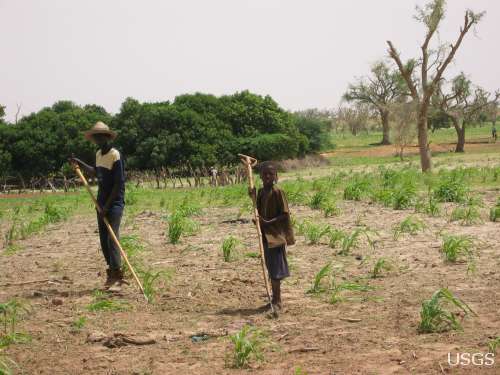
In support of the Famine Early Warning Systems Network, USGS scientists use satellite remote sensing to assess agricultural conditions that foretell famine.
New USGS research shows that rice could become adapted to climate change and some catastrophic events by colonizing its seeds or plants with the spores of tiny naturally occurring fungi. The DNA of the rice plant itself is not changed; instead, researchers are re-creating what normally happens in nature.
Now that field work has wrapped up at the Ice Age "Snowmastodon" fossil site near Snowmass Village, Colo., USGS and other scientists will begin work on unraveling the climate and environmental history of the area.
USGS scientists are studying the Earth’s conditions 3 million years ago to gain insight into the impacts of future climate. Join us Aug. 3 in Reston, Va., to learn how this information is used to better understand the magnitude of changes forecast for the end of this century.
USGS crews continue to measure streamflow and collect water quality and sediment samples in the Ohio and Mississippi River basins using state-of-art instruments.
Over the past four decades, about 14% of the ice and permanent snow of Washington's Mount Rainier has melted due to combined recent warming and reduced precipitation.
USGS science supports management, conservation, and restoration of imperiled, at-risk, and endangered species.
In a unique application of data, this year's report provides the nation's first assessment of birds on public lands and waters.
The USGS, NASA, and other organizations and Federal agencies are studying how climate change affects wildlife and ecosystems.
Using coral growth records and measurements of changing ocean chemistry from increased atmospheric CO2, USGS scientists are providing a foundation for predicting future impacts of ocean acidification and sea-level rise to coral reefs.
Increased dust storm activity may result from enhanced aridity in the Southwest, according to a USGS study.
Provide your input on the draft USGS Global Change Science Strategy by April 8, 2011.
Sea-ice habitats essential to polar bears would likely respond positively should more curbs be placed on global greenhouse gas emissions, according to a new modeling study published today in the journal, Nature.
Landscape photos taken in the same place but many years apart reveal dramatic changes due to human and natural factors. The USGS Desert Laboratory Repeat Photography Collection, the largest archive of its kind in the world, is 50 years old.
Decreasing pH and warming temperatures are changing ocean conditions and affecting coral and algal growth in South Florida. USGS scientists are conducting field measurements to learn more.
Many coastal wetlands worldwide including several on the U.S. Atlantic coast may be more sensitive than previously thought to climate change and sea-level rise in the this century.
USGS findings support recent predictions that climate change will stress ecosystems at lower elevations more than higher elevations. This information may guide future conservation efforts in helping decision makers develop regional landscape predictions about biological responses to climate changes.
The Earth as Art 3 collection, the latest set of Landsat satellite images selected for their artistic quality, reveals an intricate beauty in Earth’s natural patterns.
USGS scientists are investigating sea turtles and their habitats in Dry Tortugas National Park to provide insight that will be used as decision-support tools for managing coral ecosystems.
Looking for information on natural resources, natural hazards, geospatial data, and more? The USGS Education site provides great resources, including lessons, data, maps, and more, to support teaching, learning, K-12 education, and university-level inquiry and research.
The timing of animal migration and reproduction, and observing when plants send out new leaves and bear fruit, is increasingly important in understanding how climate change affects biological and hydrologic systems. Photo credit Copyright C Brandon Cole.
The United States Group on Earth Observations (USGEO) is working to connect Earth observations with public health, agriculture, climate, and data management and dissemination.
USGS studies the relationships among earth surface processes, ecological systems, understanding current changes in the context of prehistoric and recent earth processes, distinguishing between natural and human-influenced changes, and recognizing ecological and physical responses to changes in climate.
The USGS Science Strategy is a comprehensive report to critically examine the USGS's major science goals and priorities for the coming decade. The USGS is moving forward with these strategic science directions in response to the challenges that our Nation's future faces and for the stewards of our Federal lands.
The USGS is providing up-to-date information. Read more
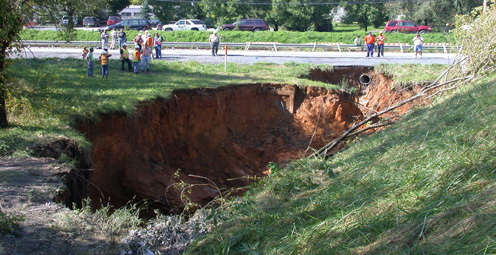
A recent devastating sinkhole in Florida has raised questions and concerns about this phenomenon. Read more
On March 3, the U.S. Geological Survey turned 134. Established by Congress in 1879 and built on a legacy of impartial science, the bureau faces unusual challenges in the near term.
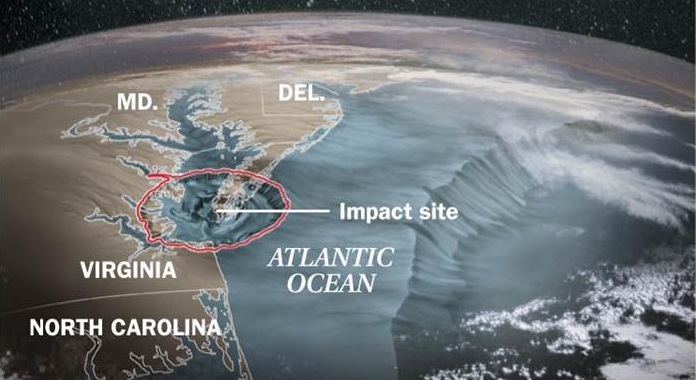
It did, 35 million years ago.

You are encouraged to participate in the Great Central U.S. ShakeOut earthquake drill to be held on Thursday, February 7, 2013. Read more
Landslides and debris flows are common and destructive geologic hazards that can happen every year in every U.S. state. Read more
The USGS is providing up-to-date information. Read more
Washington, D.C., is a unique city full of landmarks and buildings that are recognizable worldwide. But how were these stone giants built? Read more
Hurricane Sandy is a stark reminder of just how essential it is for the Nation to become more resilient to coastal hazards.Read more
The USGS is providing up-to-date information. Read more
The USGS is providing up-to-date information. Read more
Learn about USGS science on the processes that cause coastal change. Read more
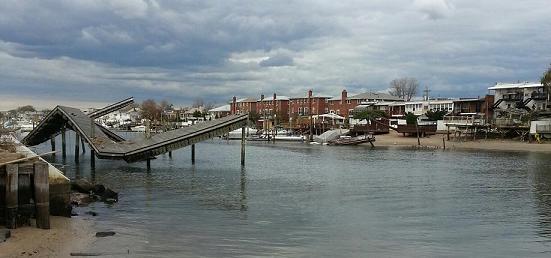
USGS crews are out surveying the damage, recovering the sensors deployed before the storm, and collecting data that will be crucial to recovery efforts.
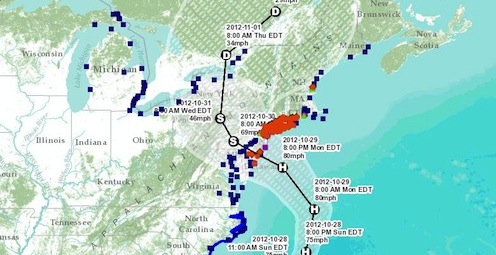
USGS is keeping careful watch as Hurricane Sandy continues to track northeast along the east coast of Florida and the Atlantic coast.
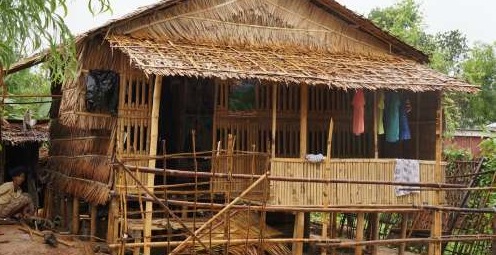
There is an urgent need for steps to mitigate earthquake risk in Burma, as it is not a question of “if” future large earthquakes will occur, but rather “when.” Read more
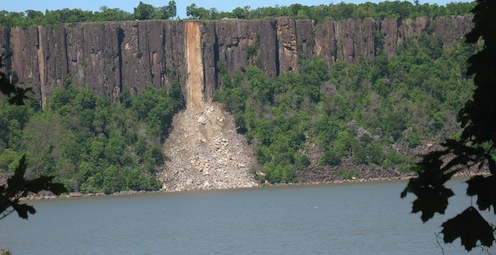
The USGS has just issued a landslide alert for parts of Maryland, Delaware, and northern Virginia. Read more
The USGS is providing up-to-date information. Read more
USGS is keeping careful watch as Hurricane Sandy continues to track northeast along the east coast of Florida and the Atlantic coast.
The earthquake struck off the west coast in the Pacific. The USGS is providing up-to-date information. Read more

Are you prepared for future earthquakes? Sign up and participate in a worldwide earthquake drill. Read more
Critically endangered birds whose numbers grew rapidly after successful translocations by USGS and USFWS biologists likely took a hit from the 2011 event. Read more
USGS science helps people understand and prepare for natural hazards. Read more
While Hurricane Isaac has passed, scientific work to understand the storm’s impact on Gulf Coast states continues. Read more
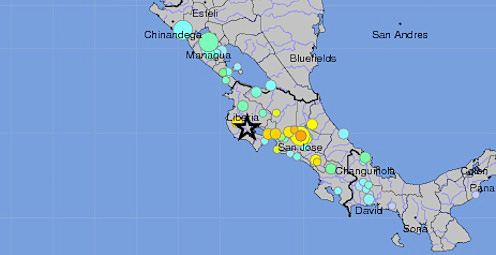
A magnitude 7.6 earthquake struck near the west coast of Costa Rica on September 5, 2012 at 14:42:10 UTC. Read more
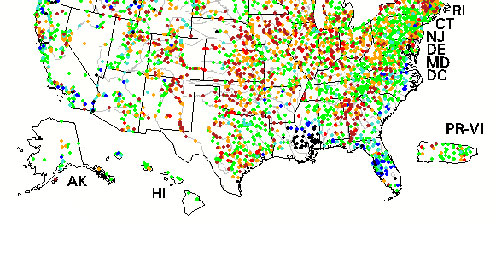
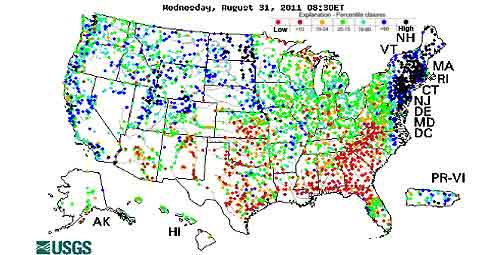
Real-time map showing the extent of flooding (black dots) and drought (red dots) in the U.S. Read more
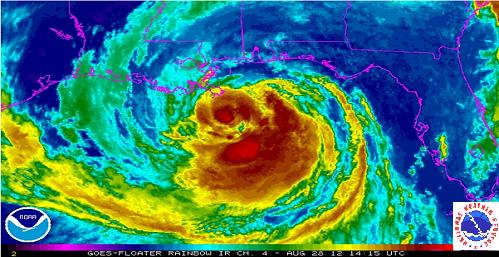
USGS scientists, engineers, and technicians are working along the Gulf coast in response to Hurricane Isaac. Read more
USGS scientists are providing up-to-date information. Read more
The U.S. Geological Survey is keeping careful watch as Tropical Storm Isaac continues to track northwest toward the west coast of Florida and the Gulf of Mexico. Read more
It was one of the largest recorded earthquakes to occur in the east over the last century. Find out what scientists have learned in the past year. Read more
USGS scientists improve systems to monitor and forecast volcanic activity and track volcanic ash to help communities prepare. Read more
These 3 young scientists have forged ahead with innovative research at the frontiers of science. Learn more
The majority of the nation is facing dry conditions; in most areas drought conditions are expected to persist or intensify. Read more
The new “Did You See It?” website collects citizen observations of landslides. Read more
Please comment on the USGS’ draft science strategies! Read more
Citizen volunteers, portable instruments, and real-time maps help improve gathering of and access to earthquake data.Read more
The USGS and partners are designing an earthquake early warning system for California to help save lives and property.
Science or Soundbite? Is the recent increase in midcontinent earthquakes natural or man-made? Find out here.
Timing is everything! Consider helping track changes in spring’s arrival
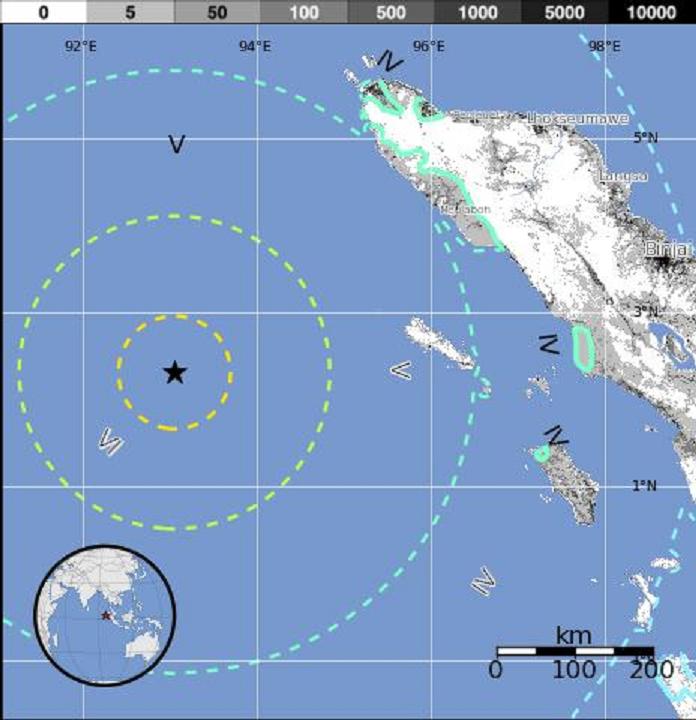
A magnitude-8.6 earthquake struck off the west coast of northern Sumatra Wednesday, April 11, 2012, at 8:38 a.m., UTC at the epicenter.
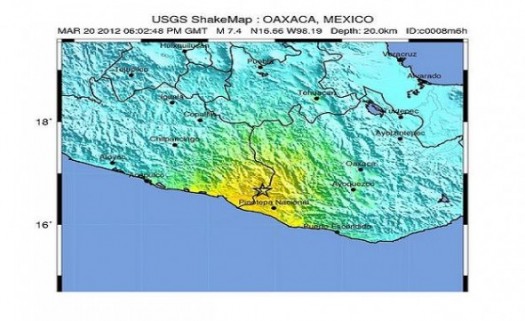
A magnitude-7.4 earthquake struck in the Mexican state of Oaxaca Tuesday, March 20, 2012, at 12:02 p.m., local time at the epicenter.
Flood Safety Awareness Week is March. 12-16. What can you do to prepare?
National Groundwater Awareness Week is Mar. 11-17, 2012. See how USGS science is connecting groundwater and surface water.
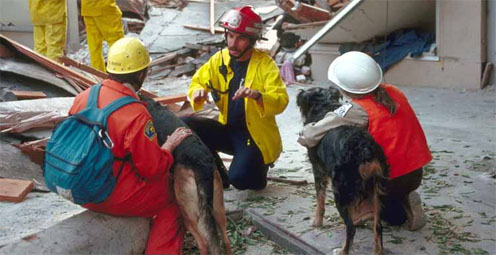
Since Japan’s March 11, 2011, Tohoku earthquake and subsequent tsunami, scientists at the USGS have learned much to help better prepare for a large earthquake in the United States.
Five USGS employees honored with Distinguished Service Awards for their service to the nation
The proposed USGS budget reflects research priorities to respond to nationally relevant issues, including water quantity and quality, ecosystem restoration, hydraulic fracturing, natural disasters such as floods and earthquakes, and support for the National Ocean Policy, and has a large R&D component.
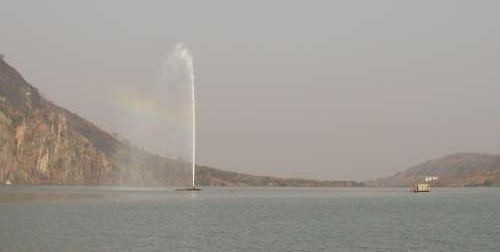
Exploding lakes in Cameroon, Africa, have killed people and livestock. Find out how USGS science is helping prevent such an event from occurring again.
Everyone is familiar with weather systems on earth like rain, wind and snow. But space weather – variable conditions in the space surrounding Earth – has important consequences for our lives inside Earth’s atmosphere.
Scientists and communities are working together to make science more useful and communities safer. What one emergency manager has to say.
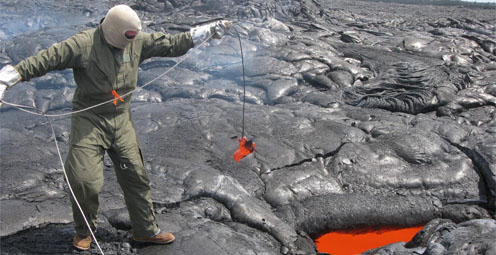
Modern volcano monitoring in the United States began with the founding of the Hawaiian Volcano Observatory in 1912. Living with volcanoes
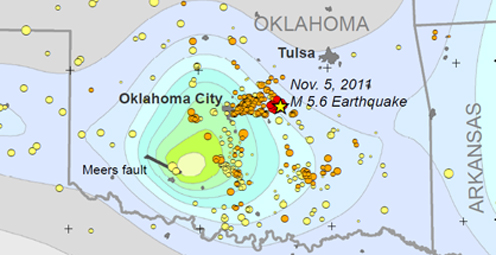
Shaking from Oklahoma's M5.6 main shock, the largest quake in the State's history, was felt from St. Louis to Lubbock. Number of quakes increasing in Oklahoma
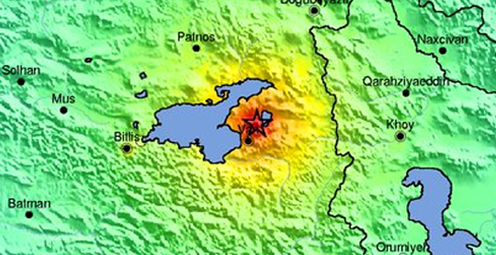
A magnitude-7.2 earthquake struck eastern Turkey on Sunday, October 23, 2011. History of strong earthquakes
It's only the beginning of their careers, but these 3 young scientists have forged ahead with innovative research at the frontiers of science. How they've transformed their fields
Oct. 9-15, 2011, is Earth Science Week, themed "Our-Ever Changing Earth," and Oct. 12, 2011, is International Day for Natural Disaster Reduction. Answers to questions posed by a changing world
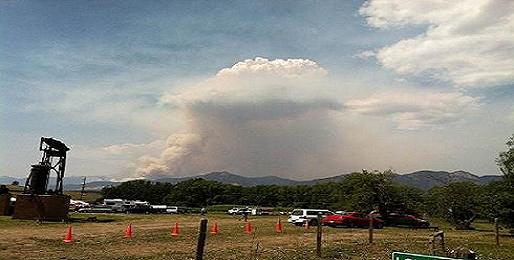
Fire managers and the public can access online maps of current wildfire locations, thanks to a Web-based mapping application provided by the USGS and its partners.
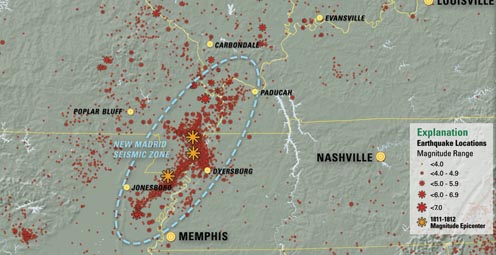
On Feb. 7, 1812, at about 3 a.m., a third, and probably most widely felt of three major earthquakes, occurred in the central Mississippi River Valley. Similar risk today.
Rivers and streams are reaching record levels as a result of Hurricane Irene’s rainfall, with more than 80 USGS streamgages measuring record peaks.
Tuesday, August 23, 2011 at 01:51 PM a 5.8 Earthquake occurred 38 miles outside of Richmond, VA.
A new geologic map of Lassen Volcanic National Park and vicinity has been created. The map area includes the entire Lassen Volcanic Center, parts of three older volcanic centers, and the products of regional volcanism.
To better understand and reduce tsunami hazards, USGS scientists examined sediment deposited by the tsunami in and around Sendai, Japan, as part of an international tsunami survey team organized by Japanese scientific cooperators.
USGS crews continue to measure streamflow and collect water quality and sediment samples in the Ohio and Mississippi River basins using state-of-art instruments.
Many communities in South Dakota, North Dakota, Montana, Colorado, Wyoming and Iowa are dealing with record floodwaters and bracing for more flooding in the upcoming weeks.
Fire managers and the public can access online maps of current wildfire locations, thanks to a web-based mapping application provided by the USGS and its partners.
New Zealand has experienced another damaging earthquake close to the city of Christchurch, which is still recovering from the magnitude-6.1 earthquake that struck in February. This latest quake has resulted in additional damage to buildings and infrastructure.
The USGS-NASA Landsat 5 satellite captured this image of 39-mile track of destruction caused by a massive tornado on June 1 near Sturbridge, MA.
As hurricane season starts, researchers are modeling potential changes to coastal environments to identify communities vulnerable to extreme erosion during storms. Data collected before and after storm landfall are used to verify past forecasts and improve future predictions.
The effects of the March 11 magnitude 9.0 earthquake and resulting tsunami on Japan are being monitored using Landsat satellite data from the USGS.
The most recent earthquake in Japan affected water levels in groundwater wells all over the country. Water level fluctuations were recorded as far away as Illinois, Virginia, Missouri and Florida.

Volcanic activity continues in the Pu`u `O`o crater on Kilauea Volcano's east rift zone and in the Halema`uma`u Crater vent at Kilauea’s summit. Visit the USGS Hawaii Volcanoes Observatory site to get detailed Kilauea and Mauna Loa activity updates, recent volcano photos, recent earthquakes, and more.
Scientists unveil a catastrophic winter storm scenario that could possibly overwhelm California's flood protection system, and significantly disrupt Statewide social and economic systems.
Heavy rainfall could potentially destabilize hillsides. The USGS Landslide Hazards Web site has what you need to know if you live in an area prone to landslides.
The USGS and the National Weather Service have developed a new flood inundation map tool that enables management officials and residents to see where the potential threat of flooding is the highest along the Flint River near Albany, Georgia.

Volcanic eruptions have always been a part of human history; the American experience is no exception. On November 3rd, USGS’s Dr. John Eichelberger discusses new USGS programs which establish monitoring networks on all hazardous US volcanoes, to reduce the effects of volcanic hazards on communities.
Kilauea is Hawaii's youngest volcano and one of the world's most active. Get daily updates on ongoing eruptions from Kilauea's summit and east rift zone.
Looking for information on natural resources, natural hazards, geospatial data, and more? The USGS Education site provides great resources, including lessons, data, maps, and more, to support teaching, learning, K-12 education, and university-level inquiry and research.
The USGS PAGER system (Prompt Assessment of Global Earthquakes for Response) will now include estimated economic loss and casualty information. This system is used by emergency responders, government and aid officials, and the public to understand the scope of the disaster to develop the best response.
Flash flooding is one of the major causes of natural hazard-related deaths in the United States and is hard to predict, but data collected by the USGS is crucial to formulating better predictive models.
The USGS Science Strategy is a comprehensive report to critically examine the USGS's major science goals and priorities for the coming decade. The USGS is moving forward with these strategic science directions in response to the challenges that our Nation's future faces and for the stewards of our Federal lands.
USGS studies the quantity and quality of groundwater to provide consistent and integrated information needed by decision-makers.
On March 3, the U.S. Geological Survey turned 134. Established by Congress in 1879 and built on a legacy of impartial science, the bureau faces unusual challenges in the near term.
Manatees are often used as sentinels for emerging threats to the ocean environment and human health. Read more
The extent and distribution of the world’s ice, primarily in the form of glaciers, provide insight about changes in the Earth’s climate and changes in sea-level. Read more
Washington, D.C., is a unique city full of landmarks and buildings that are recognizable worldwide. But how were these stone giants built? Read more
Hurricane Sandy is a stark reminder of just how essential it is for the Nation to become more resilient to coastal hazards.Read more
In honor of Earth Science Week the USGS is taking a look back into history at the scientists who laid the foundation for the innovative earth science research taking place today. Read more
The majority of the nation is still experiencing abnormally dry conditions, even after soaking rains from Isaac. Read more
While Hurricane Isaac has passed, scientific work to understand the storm’s impact on Gulf Coast states continues. Read more
Real-time map showing the extent of flooding (black dots) and drought (red dots) in the U.S. Read more
USGS scientists, engineers, and technicians are working along the Gulf coast in response to Hurricane Isaac. Read more
The U.S. Geological Survey is keeping careful watch as Tropical Storm Isaac continues to track northwest toward the west coast of Florida and the Gulf of Mexico. Read more
Fifteen years of data illuminate complex interactions driving land change in Puerto Rico. Read more
USGS scientists look to see if water quality is improving. Read more
The majority of the nation is facing dry conditions; in most areas drought conditions are expected to persist or intensify. Read more
Kati is a USGS student employee studying water and traveling the California coast. Read more
This year, a large dead zone again threatens the Gulf of Mexico. Read more
Please comment on the USGS’ draft science strategies! Read more
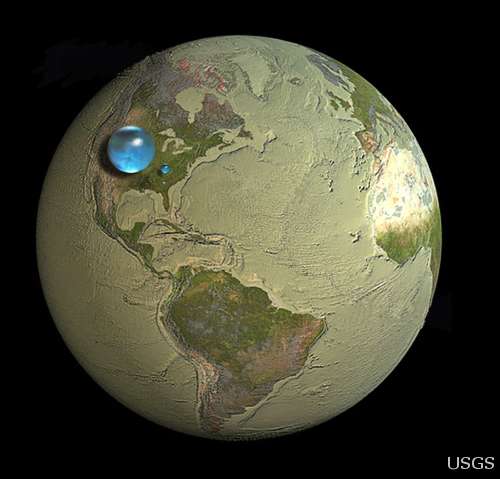
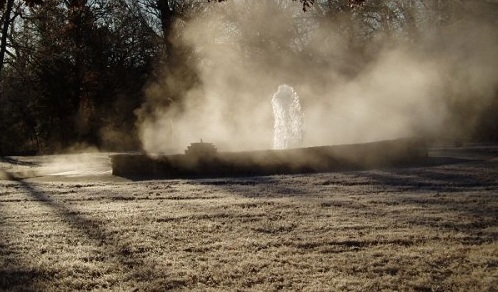
Are you surprised the water bubbles look so small? Read more
USGS Details how climate change could affect water availability in 14 U.S. Basins. Read more
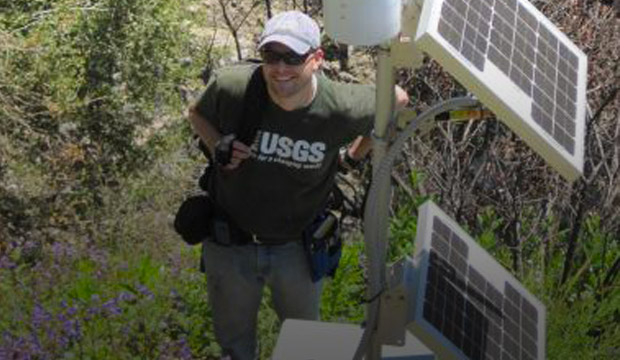
Travis Gibson shares insight into the life a USGS hydrologic technician for one of the USGS water science centers out west. Read more
The USGS plays an integral role in the new U.S. Water Partnership, which will bring together public and private resources to address water challenges around the world.
Timing is everything! Consider helping track changes in spring’s arrival
Meet one of the next generation of USGS physical scientists.
Flood Safety Awareness Week is March. 12-16. What can you do to prepare?
National Groundwater Awareness Week is Mar. 11-17, 2012. See how USGS science is connecting groundwater and surface water.
Since Japan’s March 11, 2011, Tohoku earthquake and subsequent tsunami, scientists at the USGS have learned much to help better prepare for a large earthquake in the United States.
Five USGS employees honored with Distinguished Service Awards for their service to the nation
Meet a member of the next generation of USGS hydrologic technicians.
Meet a member of the next generation of USGS hydrologic technicians.
It’s National Invasive Species Awareness Week. Did you know invasive species cost our country more than 100 billion dollars each year? Get to know America’s ten top invaders this week.
Groundwater in aquifers on the East Coast and in the Central U.S. has the highest risk of contamination from radium, a naturally occurring radioactive element and known carcinogen.
The proposed USGS budget reflects research priorities to respond to nationally relevant issues, including water quantity and quality, ecosystem restoration, hydraulic fracturing, natural disasters such as floods and earthquakes, and support for the National Ocean Policy, and has a large R&D component.
Four new reports examine the contaminants polycyclic aromatic hydrocarbons (PAHs) found in house dust, streams, lakes, soil, and air.
Exploding lakes in Cameroon, Africa, have killed people and livestock. Find out how USGS science is helping prevent such an event from occurring again.
A summer intern turned permanent employee discusses his career path. Most memorable moment
Oct. 9-15, 2011, is Earth Science Week, themed "Our-Ever Changing Earth," and Oct. 12, 2011, is International Day for Natural Disaster Reduction. Answers to questions posed by a changing world
As the team of responders struggled to end the worst oil spill in our Nation’s history, USGS scientist Paul Hsieh provided the critical scientific information needed to make a crucial decision.
After years of planning, the Department of the Interior has begun removing two dams on the Elwha River in Washington. But how will the removal of these dams impact the river’s sediments, waters, and fish?
As a nation, we use more than 75 billion gallons of groundwater each day. September 13 is the National Groundwater Association’s “Protect Your Groundwater Day.” What we can do to ensure we continue to have enough of it?
USGS scientists are working to characterize the contaminants and habitats for a number of aquatic species along the lower Columbia River.
The effects of drought are felt throughout the United States and the world, and USGS science has a prominent role in understanding the causes and consequences of this hydrological phenomenon.
USGS crews continue to measure streamflow and collect water quality and sediment samples in the Ohio and Mississippi River basins using state-of-art instruments.
Many communities in South Dakota, North Dakota, Montana, Colorado, Wyoming and Iowa are dealing with record floodwaters and bracing for more flooding in the upcoming weeks.
The most recent earthquake in Japan affected water levels in groundwater wells all over the country. Water level fluctuations were recorded as far away as Illinois, Virginia, Missouri and Florida.

Groundwater is one of our most vital natural resources. The USGS studies the quantity and quality of the nation's groundwater. Learn about USGS research in an aquifer near you.
Learn how 3-D modeling is used to examine groundwater and how this cutting edge science is used to solve tomorrow's problems today.
The Great Lakes are the largest freshwater system on Earth. However the basin has the potential for local shortages, according to a new basin-wide water availability assessment by the USGS.
The Department of the Interior has established a new website to find and share websites that provide water conservation and sustainability information.
The USGS is providing information on arsenic levels at the town level in Maine to protect human health and further promote citizen participation in State well-testing programs.
Water Security is the protection of adequate water supplies for food, fiber, industrial, and residential needs for expanding populations, which requires maximizing water-use efficiency, developing new supplies, and protecting water reserves in event of scarcity due to natural, manmade, or technological hazards.
Decreases in stream flow, which are often caused by human activities, affect the integrity of aquatic life in streams, according to a new USGS study.
The USGS and the National Weather Service have developed a new flood inundation map tool that enables management officials and residents to see where the potential threat of flooding is the highest along the Flint River near Albany, Georgia.
Looking for information on natural resources, natural hazards, geospatial data, and more? The USGS Education site provides great resources, including lessons, data, maps, and more, to support teaching, learning, K-12 education, and university-level inquiry and research.
The Chesapeake Bay has long been an R&R destination for DC residents. However, the watershed’s overpopulation contributes to its decline. Join us when USGS’s Scott Phillips and Peter Claggett discuss new science efforts applied to restoring the Nation's largest estuary on October 6th.
The "Flood and high flow" map shows the location of streamgages where the water level is currently above or near flood stage. Find out what rivers and creeks near you are doing.
Nutrient sources in both agricultural and urban areas contribute to elevated nutrient concentrations in streams and groundwater across the Nation.
USGS is playing a critical role in the federal government's coordinated Deepwater Horizon response efforts.
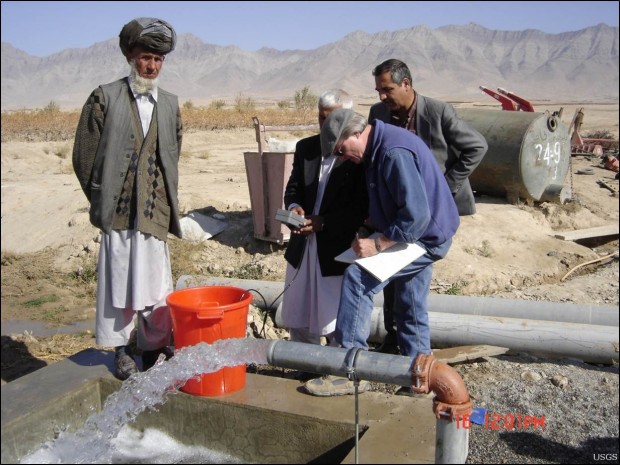
Population growth in the Kabul Basin, Afghanistan, due in part to returning refugees, is estimated to lead to a six-fold increase in drinking water needs by 2057. The USGS has worked in partnership with the Afghanistan Geological Survey to address questions of future water availability.
Flash flooding is one of the major causes of natural hazard-related deaths in the United States and is hard to predict, but data collected by the USGS is crucial to formulating better predictive models.
Did you know that contaminant-ridden dust from Africa may be harming coral reefs in the Caribbean? Scientists at the USGS are examining the air in Africa and in the Caribbean to determine what kinds of nutrients, microbes, and contaminants are traveling across the ocean.
Pharmaceutical manufacturing facilities can be a significant source of pharmaceuticals in surface water. The USGS is working with water utilities to try to reduce the release of pharmaceuticals and other emerging contaminants to the environment.
The United States Group on Earth Observations (USGEO) is working to connect Earth observations with public health, agriculture, climate, and data management and dissemination.
The USGS Science Strategy is a comprehensive report to critically examine the USGS's major science goals and priorities for the coming decade. The USGS is moving forward with these strategic science directions in response to the challenges that our Nation's future faces and for the stewards of our Federal lands.

January 24th at 7 p.m. (PST) — Public Lecture information: http://online.wr.usgs.gov/calendar

7 p.m.—Public lecture (also live-streamed over the Internet)

7 p.m.—Public lecture (also live-streamed over the Internet)

7 p.m.—Public lecture (also live-streamed over the Internet)

There are now over 60,000 maps and publications for sale for only a dollar now through May 7!

Join us in Reston on December 5th at 7:00pm for our free public lecture on the impacts of offshore wind energy development on migratory seabirds!

USGS wishes The Wildlife Society happy 75th Birthday and looks forward to attending their annual conference. Stop by our booth!

7 p.m.—Public lecture (also live-streamed over the Internet)

Join us for the July Public Lecture on Invasive Species!

USGS-led survey finds that national wildlife refuges rate highly with visitors.

As the climate has warmed, many plants are starting to grow leaves and bloom flowers earlier. A new study published in the journal, Nature, suggests that most field experiments may underestimate the degree to which the timing of leafing and flowering changes with global warming.

Stressed agricultural lands may be releasing less of the moisture needed to protect the breadbasket of a continent.

Spring rains in the eastern Horn of Africa are projected to begin late this year and be substantially lower than normal.

After nearly 2 years of meticulous research, academic and government scientists confirmed that the 2010 oil spill had damaged local coral ecosystems

In recognition of World Forestry Day, let’s take a glimpse at USGS science to understand the fate of forests from climate change.

Join us on March 7 to learn about bat white-nose syndrome, which has killed an estimate 5 million bats, and to discuss the profound impacts this emergent wildlife disease may have in the 21st century.

Scientists have discovered an outbreak of coral disease called Montipora White Syndrome in Kāneohe Bay, Oahu. The affected coral are of the species Montipora capitata, also known as rice coral.

Perhaps some of you have already experienced a sweet holiday smooch or two under the Christmas mistletoe, enjoying this fairly old kissing ritual for people. But mistletoe is important in other vital ways: it provides essential food, cover, and nesting sites for an amazing number of critters in the United States and elsewhere.
USGS scientists will join thousands of scientists, managers, and decision makers in Boston this week to present new findings on toxics at the Society for Environmental Toxicology and Chemistry (SETAC) conference in the Hynes Convention Center, Nov. 13-17.

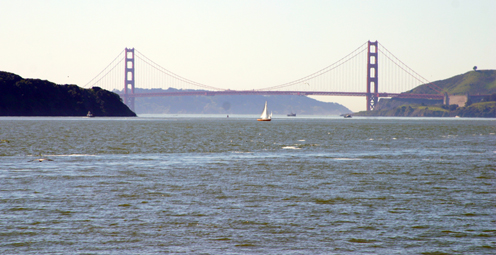
On Nov. 3, USGS scientists Patrick Barnard and William Ellsworth will present a public lecture in Menlo Park, CA, providing Bay Area residents information about USGS research in the San Francisco Bay Area, including recent discoveries beneath San Francisco Bay and ongoing studies to better understand earthquake probabilities and the potential hazards associated with strong ground shaking.

Meet the R/V Muskie and the R/V Kaho, the USGS Great Lakes Science Center's two newest additions to its Great Lakes research fleet!

As climate changes, it affects the timing of when leaves emerge, the amount of foliage that grows as well as the timeframe when leaves begin to fall.

How will accelerated glacial melting over the next 50 years as a result of climate change affect the unique Gulf of Alaska and Copper River coastal ecosystems? USGS scientists are studying these processes and impacts.

The U.S. Geological Survey research looked at one of the world’s largest populations of long-tail ducks and found that hundreds of thousands of these elusive birds engage in a bizarre 30-50 mile morning commute from Nantucket Sound to the Atlantic Ocean, returning each evening.

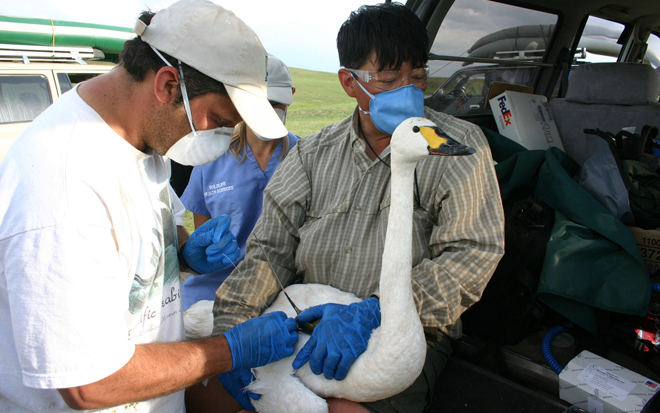
Taking advantage of USGS expertise in satellite telemetry, geospatial mapping and analysis and waterfowl migration monitoring, researchers have tracked waterfowl across Asia, Eastern Europe, and Africa and discovered new flu transmission links.

USGS is working in collaboration with numerous state and federal agencies and tribes to obtain approval for field trials with vaccine-laden, peanut-butter flavored baits and evaluate the safety and effectiveness of the vaccine in grasslands.

Psychedelically colored wolves depicted by thermal imaging will shed light on how mange affects the survival, reproduction and social behavior of wolves in Yellowstone National Park.

This lecture will address how physical factors affect viticulture and food, examining some food and wine producing areas in France, California, and Washington State.
7 p.m.—Public lecture (also live-streamed over the Internet)

Despite news articles warning of large-scale releases of methane due to climate change, recent research indicates that most of the world’s gas hydrate deposits should remain stable for the next few thousand years.

Although no one is quite sure where the coal for naughty kids custom came from, the truth is that coal has long been a very important part of our daily lives, let alone our holiday traditions. USGS has studied coal for much of our more than 130-year existence.
USGS scientists will join thousands of scientists, managers, and decision makers in Boston this week to present new findings on toxics at the Society for Environmental Toxicology and Chemistry (SETAC) conference in the Hynes Convention Center, Nov. 13-17.

In research released September 29, 2011, USGS announced that it had mapped more than 96 percent ofAfghanistanwith hyperspectral imaging (also referred to as imaging spectroscopy data). That’s more than any other country in the world, including the U.S. Using a WB-57 aircraft as well as ground-based tools, USGS scientists directed a campaign to collect andContinue Reading

Join us on October 5th to learn more about the minerals we use on a daily basis, where these resources come from, and the steps involved from mineral discovery to mineral use.

USGS scientists are assessing the potential to remove CO2 from the atmosphere for storage in other Earth systems through a process called carbon sequestration.
7 p.m.—Public lecture (also live-streamed over the Internet)
After nearly 2 years of meticulous research, academic and government scientists confirmed that the 2010 oil spill had damaged local coral ecosystems
In recognition of World Forestry Day, let’s take a glimpse at USGS science to understand the fate of forests from climate change.
Join us on March 7 to learn about bat white-nose syndrome, which has killed an estimate 5 million bats, and to discuss the profound impacts this emergent wildlife disease may have in the 21st century.
Scientists have discovered an outbreak of coral disease called Montipora White Syndrome in Kāneohe Bay, Oahu. The affected coral are of the species Montipora capitata, also known as rice coral.

Recent USGS research shows that climate, vegetation, groundwater recharge rate, and proximity of the contaminants to the water table can all affect and control natural removal rates.
USGS scientists will join thousands of scientists, managers, and decision makers in Boston this week to present new findings on toxics at the Society for Environmental Toxicology and Chemistry (SETAC) conference in the Hynes Convention Center, Nov. 13-17.
On Nov. 3, USGS scientists Patrick Barnard and William Ellsworth will present a public lecture in Menlo Park, CA, providing Bay Area residents information about USGS research in the San Francisco Bay Area, including recent discoveries beneath San Francisco Bay and ongoing studies to better understand earthquake probabilities and the potential hazards associated with strong ground shaking.
Taking advantage of USGS expertise in satellite telemetry, geospatial mapping and analysis and waterfowl migration monitoring, researchers have tracked waterfowl across Asia, Eastern Europe, and Africa and discovered new flu transmission links.
USGS is working in collaboration with numerous state and federal agencies and tribes to obtain approval for field trials with vaccine-laden, peanut-butter flavored baits and evaluate the safety and effectiveness of the vaccine in grasslands.
Psychedelically colored wolves depicted by thermal imaging will shed light on how mange affects the survival, reproduction and social behavior of wolves in Yellowstone National Park.
7 p.m.—Public lecture (also live-streamed over the Internet)
USGS-led survey finds that national wildlife refuges rate highly with visitors.
As the climate has warmed, many plants are starting to grow leaves and bloom flowers earlier. A new study published in the journal, Nature, suggests that most field experiments may underestimate the degree to which the timing of leafing and flowering changes with global warming.
Stressed agricultural lands may be releasing less of the moisture needed to protect the breadbasket of a continent.
Spring rains in the eastern Horn of Africa are projected to begin late this year and be substantially lower than normal.
In recognition of World Forestry Day, let’s take a glimpse at USGS science to understand the fate of forests from climate change.

A new study concludes that fossil fuel emissions are likely contributors to a substantial amount of organic carbon found on glaciers in Alaska. Fossil fuel emissions, which contain organic carbon, can speed up the rate of glacier melt when deposited on glacier surfaces. In addition, the organic molecules associated with these deposits can be transportedContinue Reading
Despite news articles warning of large-scale releases of methane due to climate change, recent research indicates that most of the world’s gas hydrate deposits should remain stable for the next few thousand years.
Join us on February 1 to view the Earth from space, and discuss the profound impact Landsat has on many facets of our economy, safety, and environment.
Scientists have discovered an outbreak of coral disease called Montipora White Syndrome in Kāneohe Bay, Oahu. The affected coral are of the species Montipora capitata, also known as rice coral.
USGS scientists will join thousands of scientists, managers, and decision makers in Boston this week to present new findings on toxics at the Society for Environmental Toxicology and Chemistry (SETAC) conference in the Hynes Convention Center, Nov. 13-17.
On Nov. 3, USGS scientists Patrick Barnard and William Ellsworth will present a public lecture in Menlo Park, CA, providing Bay Area residents information about USGS research in the San Francisco Bay Area, including recent discoveries beneath San Francisco Bay and ongoing studies to better understand earthquake probabilities and the potential hazards associated with strong ground shaking.

Rivers and streams in the United States are releasing substantially more carbon dioxide into the atmosphere than previously thought.

Climate Change Impacts to Tribal Communities The USGS is working with Native American communities and organizations to understand climate change impacts to their land and neighborhoods. Projects include interviews with indigenous Alaskans to understand their personal observations of climate change, as well as studying how climate change is impacting sand dunes and posing risksContinue Reading
As climate changes, it affects the timing of when leaves emerge, the amount of foliage that grows as well as the timeframe when leaves begin to fall.
How will accelerated glacial melting over the next 50 years as a result of climate change affect the unique Gulf of Alaska and Copper River coastal ecosystems? USGS scientists are studying these processes and impacts.
USGS scientists are assessing the potential to remove CO2 from the atmosphere for storage in other Earth systems through a process called carbon sequestration.
")
February 28th at 7 p.m. (PST) — Public Lecture information: http://online.wr.usgs.gov/calendar

In response to Hurricane Isaac, USGS has deployed several hundred storm surge sensors to collect information about the effects of Isaac on the Gulf Coast.

Join us on September 5th in Reston, VA for a free public lecture on the 2011 Virginia earthquake!

Join us on August 1 to learn more about the anatomy of flooding: What are the different causes of these extreme events, and how is USGS science helping prepare residents for future foods.

Join us on June 6 for a centennial look at the greatest volcanic eruption of the 20th century at our June Public Lecture!
In recognition of World Forestry Day, let’s take a glimpse at USGS science to understand the fate of forests from climate change.

The Volcano Hazards Program announces the establishment of the USGS California Volcano Observatory (CalVO), which expands and replaces the former Long Valley Observatory.
On Nov. 3, USGS scientists Patrick Barnard and William Ellsworth will present a public lecture in Menlo Park, CA, providing Bay Area residents information about USGS research in the San Francisco Bay Area, including recent discoveries beneath San Francisco Bay and ongoing studies to better understand earthquake probabilities and the potential hazards associated with strong ground shaking.

Join USGS scientists on November 2nd to discuss the seismology of the M5.8 Virginia earthquake, its effects, and its context in the geology of Virginia.
February 28th at 7 p.m. (PST) — Public Lecture information: http://online.wr.usgs.gov/calendar
In response to Hurricane Isaac, USGS has deployed several hundred storm surge sensors to collect information about the effects of Isaac on the Gulf Coast.
7 p.m.—Public lecture (also live-streamed over the Internet)
Join us on August 1 to learn more about the anatomy of flooding: What are the different causes of these extreme events, and how is USGS science helping prepare residents for future foods.

Join us in Menlo Park for our Evening Lecture on Scanning the Seafloor with Sound!
Stressed agricultural lands may be releasing less of the moisture needed to protect the breadbasket of a continent.

Over the next 10 years, the USGS plans to conduct a new assessment of water availability and use. This national Water Census will address critical aspects of recent Federal legislation, including the need to establish a national water assessment program.
Recent USGS research shows that climate, vegetation, groundwater recharge rate, and proximity of the contaminants to the water table can all affect and control natural removal rates.
USGS scientists will join thousands of scientists, managers, and decision makers in Boston this week to present new findings on toxics at the Society for Environmental Toxicology and Chemistry (SETAC) conference in the Hynes Convention Center, Nov. 13-17.
On Nov. 3, USGS scientists Patrick Barnard and William Ellsworth will present a public lecture in Menlo Park, CA, providing Bay Area residents information about USGS research in the San Francisco Bay Area, including recent discoveries beneath San Francisco Bay and ongoing studies to better understand earthquake probabilities and the potential hazards associated with strong ground shaking.
Rivers and streams in the United States are releasing substantially more carbon dioxide into the atmosphere than previously thought.
Meet the R/V Muskie and the R/V Kaho, the USGS Great Lakes Science Center's two newest additions to its Great Lakes research fleet!

![]() U.S. Department of the Interior |
U.S. Geological Survey
U.S. Department of the Interior |
U.S. Geological Survey
URL: www.usgs.gov/blogs/features/usgs_science_pick/a-look-back-at-the-usgs%e2%80%99s-2011-highlights/
Page Contact Information: Ask USGS
Page Last Modified: September 14, 2011