Science Features
 Loading Page...

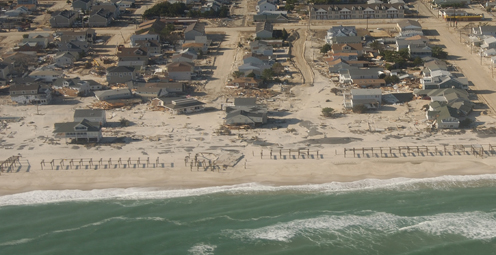
A number of ocean front homes were destroyed or severely damaged during Hurricane Sandy on Fire Island, NY. The photo shows what remains of houses in the community of Davis Park. (Photo: Cheryl Hapke, USGS)
Hurricane Sandy is a stark reminder of just how essential it is for the Nation to become more resilient to coastal hazards. More than half of the U.S. population lives within 50 miles of a coast, and this number is increasing.
“USGS science has been instrumental in helping communities use zoning and building standards to mitigate earthquake losses and in the prediction of volcanic activity to keep people and property out of harm’s way,” said Director of the U.S. Geological Survey (USGS) Marcia McNutt. “I have every reason to expect that a focus on science related to hurricanes will have a similar return on investment.”
The USGS is the largest provider of hydrologic information in the world. Federal, state, and local partners depend on USGS science to know how to prepare for hurricane hazards and reduce losses from future hurricanes. The USGS works closely with the Federal Emergency Management Agency, the National Weather Service, the U.S. Army Corps of Engineers, and many state and local agencies to identify their information needs before, during, and after hurricanes and to provide the data and science they need to assess storm impacts and understand the potential threats posed by future storms.
“First, we work across the shoreline, to help predict and document the impact of hurricane-generated storm surge to the regions where people live, work, and play,” added McNutt. “Second, we bring the perspective of more than 130 years of data from our vast USGS records. This information allows us to understand and share knowledge of the interaction between man-made influences and natural processes, such as the movement of sand in near-shore environments and the factors that affect water circulation and salinity in coastal bays. Finally, we offer an integrated science approach that combines expertise in coastal processes, hydrology, mapping, climate change research, and marine ecology, enabling us to address the critical research questions.”
USGS – Providing Science Before, During and After Hurricanes

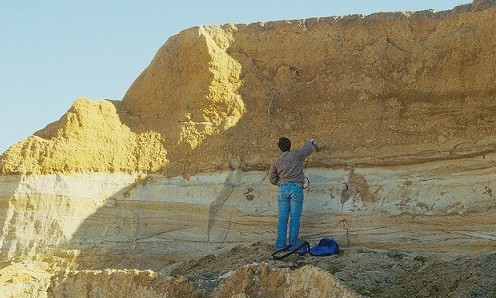
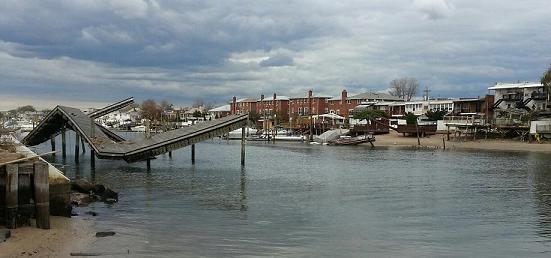
View looking west along the New Jersey shore. Storm waves and surge cut across the barrier island at Mantoloking, NJ, eroding a wide beach, destroying houses and roads, and depositing sand onto the island and into the back-bay. Construction crews with heavy machinery are seen clearing sand from roads and pushing sand seaward to build a wider beach and protective berm just days after the storm. The yellow arrow in each image points to the same feature.
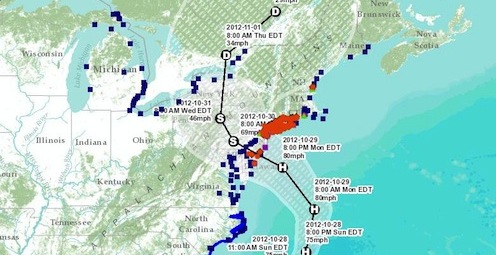
Hurricane Sandy in late 2012, one of the largest hurricanes to strike the east coast of the United States, killed more than 100 people, caused billions of dollars in damage, and wreaked havoc. Before and during Hurricane Sandy, USGS scientists from all over the country worked around the clock to create and issue predictions of coastal impacts; to deploy a vast number of storm-surge sensors that recorded the height of the water surface along the coast and the inland movement of water; and to collect data documenting the storm’s impact.
“The data provided by the USGS tide gages that were placed along the Connecticut coastline prior to the landfall of Hurricane Sandy provided extremely valuable information on tide levels during the storm,” said Douglas Glowacki, Emergency Management Program Specialist, Connecticut Department of Emergency Services and Public Protection. “The data downloaded from the USGS gag
es after Hurricane Sandy has greatly aided Connecticut in determining the return frequency for a hurricane like Sandy and also confirmed that Sandy was a record-breaking storm for much of the coastline. In addition, this data will help local planners and architects during the rebuilding process to mitigate losses from future storm events.”
The USGS also conducted LiDAR flight surveys along the coast that precisely imaged the before- and-after state of the sand dunes. By using observations of beach changes and models of waves and storm surge, scientists can predict how the coast will respond to hurricanes and can identify vulnerable areas. Following Sandy, the USGS predictions of vulnerable areas of the coast allowed limited resources to be targeted to areas most at risk, saving lives and property. These vital data sets will also lead to new understandings of hurricane impacts on coastal regions and can aid decision makers if they decide to rebuild.
“The coastal impact assessment products provided by the USGS have been a critical resource for us on the Federal team to help identify and prioritize impact-related data collection, issue identification and resource evaluation,” said NOAA’s Sandy Eslinger, who serves as Coastal Coordinator for the Inter-agency Natural and Cultural Resources Recovery Team in New York.
Long Island, New York, including Fire Island, was extensively impacted. Prior to Sandy’s landfall, a USGS team surveyed the pre-storm state of the beaches and dunes, and the team remained nearby to conduct rapid post-storm surveys, including LiDAR flights. Most oceanfront homes in the communities within Fire Island National Seashore were damaged or destroyed, and the island was breached in three locations. Measurements of dune and beach erosion indicate that 50 percent of the Fire Island shoreline was overwashed, and dunes were eroded landward by as much as 43 meters. Surveys of beach and dune volume indicate that more than 60 percent of pre-storm volume was lost. Elevation decreased by as much as five meters, increasing the vulnerability of the coast to future storms.
“USGS efforts to measure pre- and post-storm Sandy water levels in the bays and water velocity in the breach at Old Inlet has been a help in answering questions regarding the impact of breaches through the barrier islands,” said Fred Anders, New York Department of State, Division of Coastal Resources. “The USGS has also been helpful in flying LiDAR to demonstrate storm impacts and measuring high water marks on the mainland, which will allow us to understand the flooding impact…so that we can use [this information] to help define the areas that were compromised and follow with identification of assets at risk and options for risk reduction.”
Helping Communities Move Forward
The New Jersey coastline, including Barnegat Bay, New Jersey, also shows the value of long-term science data and partnerships before, during, and after a hurricane crisis.
Pre- and post-Sandy LiDAR and field surveys along the New Jersey coastline show substantial loss of protective beach and dune features, elevation decreases of up to six meters, and the location of the inlet that broke through the barrier beach community of Mantoloking during Hurricane Sandy. Pre- and post-storm LiDAR data were also collected throughout Barnegat Bay to document how the storm affected the bathymetry of the bay. This information will be used to better understand how the circulation patterns of Barnegat Bay were altered by Sandy and how these changes will affect the ecosystem of the bay. The LiDAR data will also be used to identify changes in elevation throughout the bay and help locate debris washed into the bay. This information is important to help decision-makers target where response efforts should focus, including locations of sand needs and sources, and debris removal.
For the last decade, the USGS and the New Jersey Department of Homeland Security have been supporting 25 real-time tidal gages, five real-time meteorological gages, and 31 tidal crest-stage gages in New Jersey, which monitor water levels in flood-prone coastal areas and back bays. When a station detects water at flood-threat levels, it issues a message via telephone to warn municipal and county emergency-management officials and National Weather Service forecasters, and increases the frequency of satellite transmissions from hourly to six-minute intervals. The USGS and the New Jersey Department of Environmental Protection are also using the data collected from these networks to conduct an investigation of Barnegat Bay’s water and sediment quality.
Moving forward, USGS science is positioned to help answer questions such as: what locations along the coast are forecasted to be the most vulnerable to future hurricanes? Are there chemical and microbial contaminant impacts? How have the high-water levels during storms impacted coastal bays and estuaries? What were the storm impacts to ecosystems, habitats, fish and wildlife?
“Perhaps, with the help of some compelling science, Hurricane Sandy will be another catalyst for helping coastal residents in hurricane country learn how to live more safely near the ocean,” concluded McNutt.
Manatees are often used as sentinels for emerging threats to the ocean environment and human health. Read more
The USGS plans to "app-lify" data with a contest through Challenge.gov. Prizes will be awarded to the best overall app, the best student app, and the people’s choice. Read more
Washington, D.C., is a unique city full of landmarks and buildings that are recognizable worldwide. But how were these stone giants built? Read more
Please comment on the USGS’ draft science strategies! Read more

Meet Marnelli Taasin, a student trainee working in Administrative Management with the USGS in Hawaii. Read more
Timing is everything! Consider helping track changes in spring’s arrival
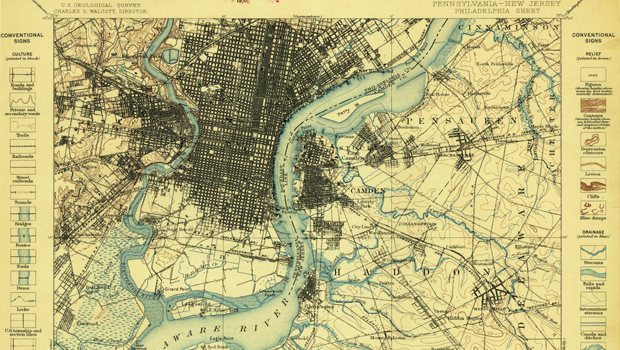
Need a historical map for your genealogy research? You are in luck. We’ve got what you need! Download and view USGS historical maps from the comfort of your own home.
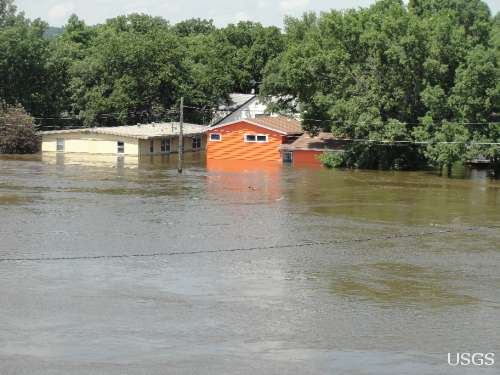
Flood Safety Awareness Week is March. 12-16. What can you do to prepare?
National Groundwater Awareness Week is Mar. 11-17, 2012. See how USGS science is connecting groundwater and surface water.
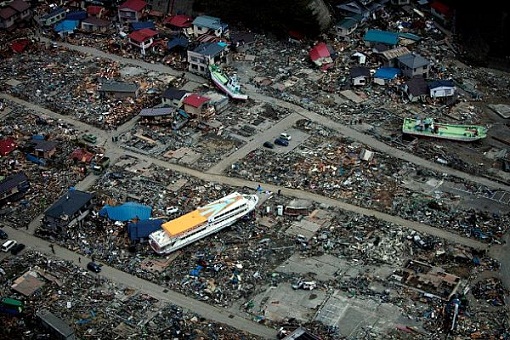
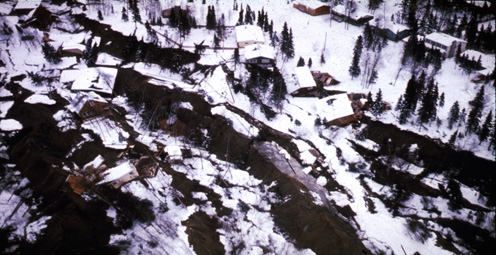
Since Japan’s March 11, 2011, Tohoku earthquake and subsequent tsunami, scientists at the USGS have learned much to help better prepare for a large earthquake in the United States.

Five USGS employees honored with Distinguished Service Awards for their service to the nation
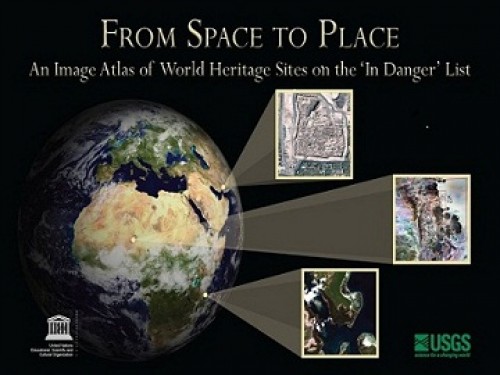
The USGS and UNESCO have produced a book that gives us a new way to look at our shared global heritage.
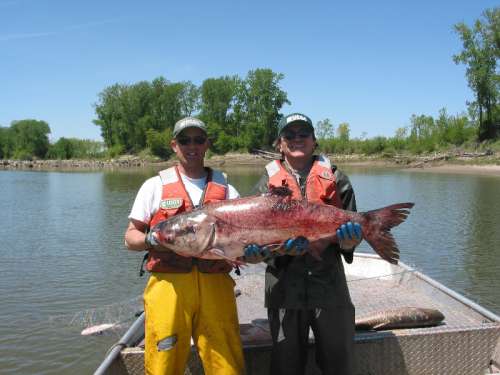
It’s National Invasive Species Awareness Week. Did you know invasive species cost our country more than 100 billion dollars each year? Get to know America’s ten top invaders this week.
The proposed USGS budget reflects research priorities to respond to nationally relevant issues, including water quantity and quality, ecosystem restoration, hydraulic fracturing, natural disasters such as floods and earthquakes, and support for the National Ocean Policy, and has a large R&D component.
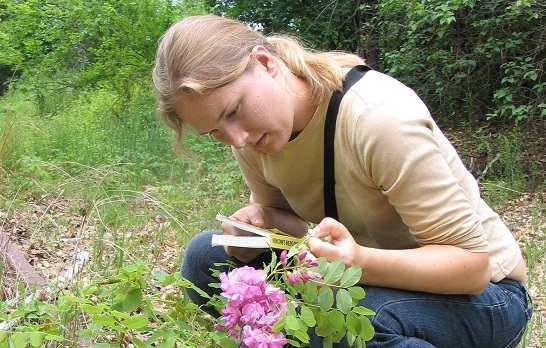
A student geographer shares her experiences and career path with the USGS. Most memorable moment

Everyone is familiar with weather systems on earth like rain, wind and snow. But space weather – variable conditions in the space surrounding Earth – has important consequences for our lives inside Earth’s atmosphere.
USGS crews continue to measure streamflow and collect water quality and sediment samples in the Ohio and Mississippi River basins using state-of-art instruments.
Science earns prominent focus in the new Department of the Interior Five-Year Strategic Plan.
http://www.facebook.com/USGeologicalSurvey
Manatees are often used as sentinels for emerging threats to the ocean environment and human health. Read more
The USGS plans to "app-lify" data with a contest through Challenge.gov. Prizes will be awarded to the best overall app, the best student app, and the people’s choice. Read more
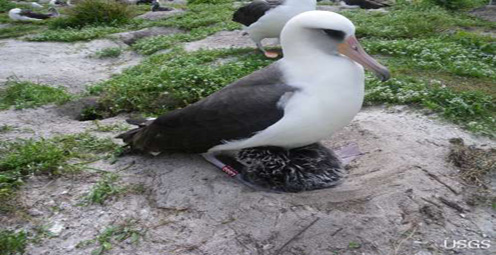
The world’s oldest known wild bird – now 62 – is a mother again. Read more
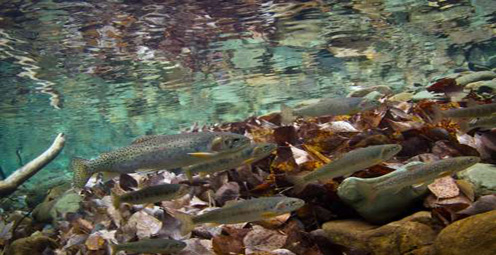
The recent past sheds light on preserving the future of economically and ecologically important native trout populations across the West. Read more
Washington, D.C., is a unique city full of landmarks and buildings that are recognizable worldwide. But how were these stone giants built? Read more
The 100 million tons of carbon sequestered in western ecosystems each year is an amount equivalent to – and counterbalances the emissions of – more than 83 million U.S. passenger cars a year. Read more
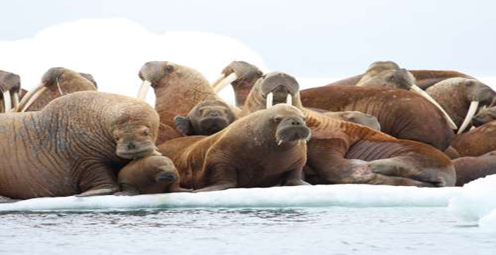
Watch USGS scientists in the Arctic track Pacific walruses to examine how these animals are faring in a world with less sea ice. Read more
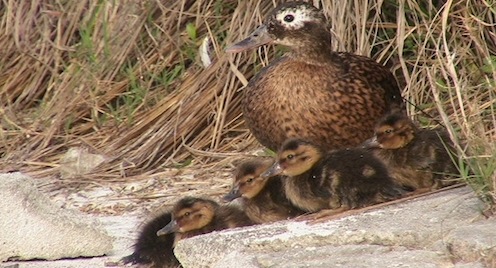
Critically endangered birds whose numbers grew rapidly after successful translocations by USGS and USFWS biologists likely took a hit from the 2011 event. Read more
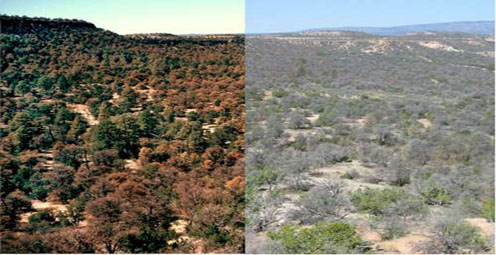
Trees Face Rising Drought Stress and Mortality as Climate Warms. Read more
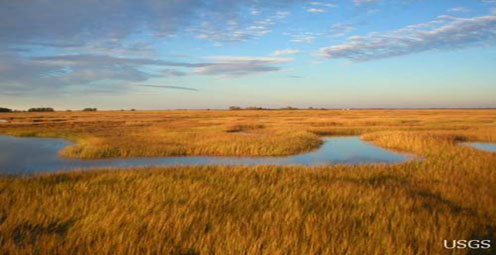
Saltmarshes may slow the rate of climate change. Read more
USGS vigilant for West Nile virus in wildlife through surveillance, research, and mapping.
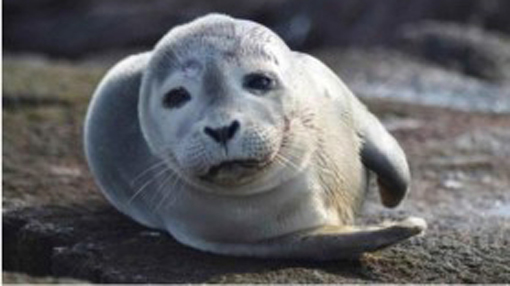
USGS and its partners are investigating the unusual deaths of New England harbor seals. Read more
USGS scientists look to see if water quality is improving. Read more

The majority of the nation is facing dry conditions; in most areas drought conditions are expected to persist or intensify. Read more
After dams tumble down, what happens next? Click here to find out! Read more
Maximizing alternative energy’s potential – how science can help grow the nation’s energy portfolio. Read more
Please comment on the USGS’ draft science strategies! Read more
USGS Details how climate change could affect water availability in 14 U.S. Basins. Read more
Western stream temperatures are not warming at the same rate as air temperature.Read more
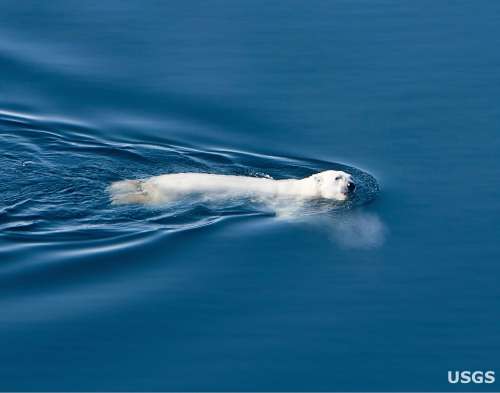
Long polar bear swims provide tantalizing clues.Read more
The larger and more aggressive Eastern species thrives in a threatened species’ forest habitat.
While on your spring hike, beware of hitchhiking ticks—they may carry Lyme Disease.
For the first time since its discovery, White-nose syndrome has been found in the West.

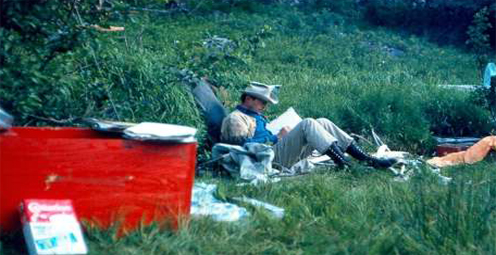
The family picnic: food and fun...until unwanted guests show up! Learn what you can do to prevent West Nile virus from infecting your loved ones.
Timing is everything! Consider helping track changes in spring’s arrival
Flood Safety Awareness Week is March. 12-16. What can you do to prepare?
National Groundwater Awareness Week is Mar. 11-17, 2012. See how USGS science is connecting groundwater and surface water.
Since Japan’s March 11, 2011, Tohoku earthquake and subsequent tsunami, scientists at the USGS have learned much to help better prepare for a large earthquake in the United States.
Five USGS employees honored with Distinguished Service Awards for their service to the nation
It’s National Invasive Species Awareness Week. Did you know invasive species cost our country more than 100 billion dollars each year? Get to know America’s ten top invaders this week.
It’s National Invasive Species Awareness Week. Did you know invasive species cost our country more than 100 billion dollars each year? Get to know America’s ten top invaders this week.
It’s National Invasive Species Awareness Week. Did you know invasive species cost our country more than 100 billion dollars each year? Get to know America’s ten top invaders this week.
It’s National Invasive Species Awareness Week. Did you know invasive species cost our country more than 100 billion dollars each year? Get to know America’s ten top invaders this week.
The proposed USGS budget reflects research priorities to respond to nationally relevant issues, including water quantity and quality, ecosystem restoration, hydraulic fracturing, natural disasters such as floods and earthquakes, and support for the National Ocean Policy, and has a large R&D component.
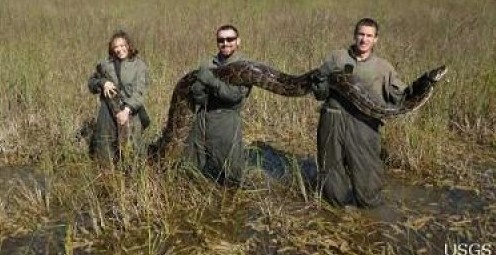
Mid-sized mammals in Everglades National Park are getting a big squeeze from invasive Burmese pythons, according to a USGS co-authored study published in the Proceedings of the National Academy of Sciences.
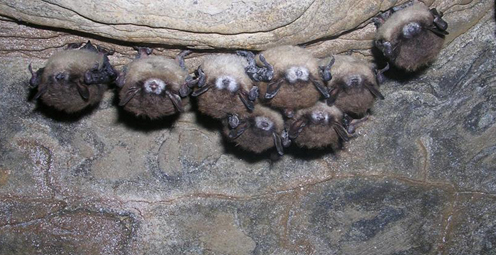
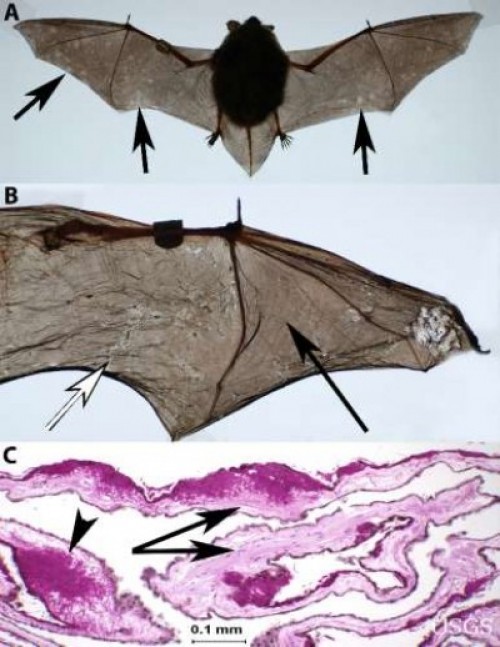
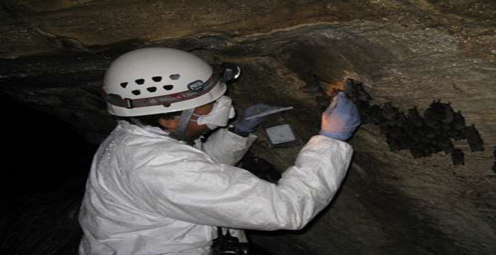
Bat populations, which provide valuable insect control, are declining at an alarming rate due to white-nose syndrome. Scientists have definitively identified the cause of this deadly syndrome.
Two adolescent cranes, raised by humans and reintroduced into the wild, were shot and killed. Sadly, they are not the first. How many killed this year? How many are left?
By 1936, devastating losses of wildlife populations were threatening the Nation’s natural resource heritage. America's first wildlife research center
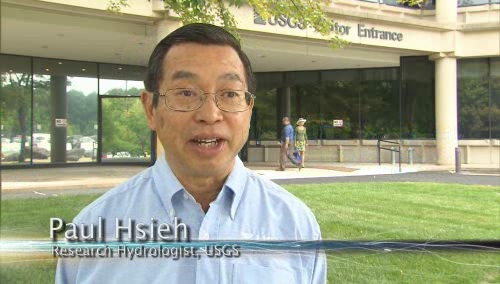
As the team of responders struggled to end the worst oil spill in our Nation’s history, USGS scientist Paul Hsieh provided the critical scientific information needed to make a crucial decision.
The movie Contagion dramatizes the scenario of a global pandemic that begins with the spread of a disease from animals to humans. What are real-life experts doing to prevent a pandemic that originates with wildlife?
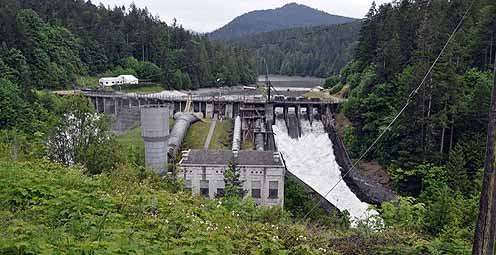
After years of planning, the Department of the Interior has begun removing two dams on the Elwha River in Washington. But how will the removal of these dams impact the river’s sediments, waters, and fish?
As a nation, we use more than 75 billion gallons of groundwater each day. September 13 is the National Groundwater Association’s “Protect Your Groundwater Day.” What we can do to ensure we continue to have enough of it?
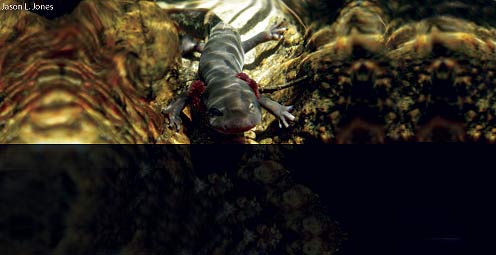
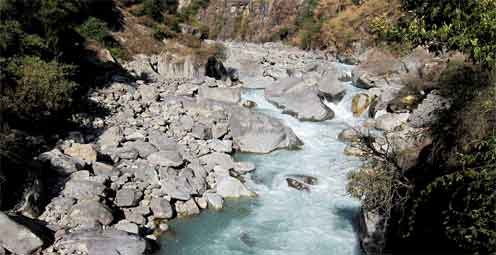
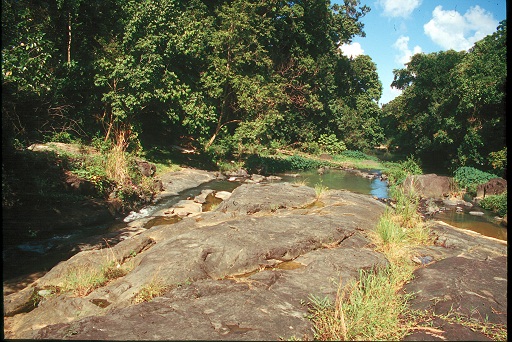
Secretive and rare stream-dwelling amphibians are difficult to find and study. Scientists at the US Geological Survey and University of Idaho have developed a way to detect free-floating DNA from amphibians in fast-moving stream water.
Within the rivers, streams, and lakes of North America live over 200 species of freshwater mussels that share an amazing life history. Join us in Reston, VA to explore the fascinating reproductive biology and ecological role of one of nature’s most sophisticated fishermen.
USGS scientists are working to characterize the contaminants and habitats for a number of aquatic species along the lower Columbia River.
Forests play a significant role in removing carbon from the atmosphere by absorbing one-third of carbon emissions annually. This is according to a new U.S. Forest Service study conducted in collaboration with USGS scientists.
New USGS research shows that rice could become adapted to climate change and some catastrophic events by colonizing its seeds or plants with the spores of tiny naturally occurring fungi. The DNA of the rice plant itself is not changed; instead, researchers are re-creating what normally happens in nature.
A new study supports the ecological reliance of red knots on horseshoe crabs. The well-being of red knots, a declining shorebird species, is directly tied to the abundance of nutrient-rich eggs spawned by horseshoe crabs.
USGS crews continue to measure streamflow and collect water quality and sediment samples in the Ohio and Mississippi River basins using state-of-art instruments.
Native Bees are Selective About Where They Live and Eat -- It's National Pollinator Week, and here's groundbreaking research about the world of our native bees.
As hurricane season starts, researchers are modeling potential changes to coastal environments to identify communities vulnerable to extreme erosion during storms. Data collected before and after storm landfall are used to verify past forecasts and improve future predictions.
Follow the Pacific Nearshore Project as researchers from the USGS, Monterey Bay Aquarium, and other institutions sail Alaskan waters to study sea otters and investigate coastal health.
USGS science supports management, conservation, and restoration of imperiled, at-risk, and endangered species.
New USGS research shows that certain lichens can break down the infectious proteins responsible for chronic wasting disease, a troubling neurological disease fatal to wild deer and elk and spreading throughout the United States and Canada.
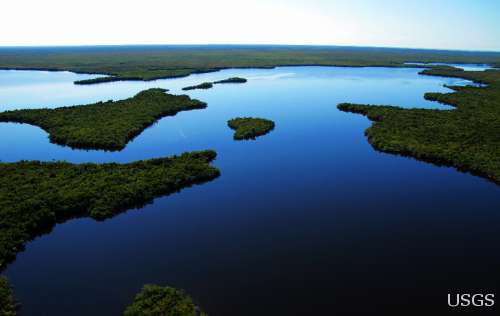
It's time to celebrate the essential role wetlands play in giving us food and water; sheltering us from storms, floods, and coastal erosion; providing habitat for birds, fish, and other wildlife; and cleaning and storing water.
In a unique application of data, this year's report provides the nation's first assessment of birds on public lands and waters.

For reliable information about amphibians and the environmental factors that are important to their management and conservation, visit the new USGS Amphibian Monitoring and Research Initiative website.

A new article explains the economic importance of insect-eating bats to U.S. agriculture and how white-nose syndrome and wind turbines threaten these valuable animals.

Using coral growth records and measurements of changing ocean chemistry from increased atmospheric CO2, USGS scientists are providing a foundation for predicting future impacts of ocean acidification and sea-level rise to coral reefs.

Non-native lionfish are rapidly spreading along the U.S. Eastern seaboard, Gulf of Mexico, and Caribbean and have been preying on and competing with a wide range of native species.

On Midway Island, Wisdom, a 60-year-old albatross, and her chick made it through the tsunami that resulted from the magnitude 9.0 earthquake off of Japan on March 11.
Please answer questions about USGS Ecosystems science.
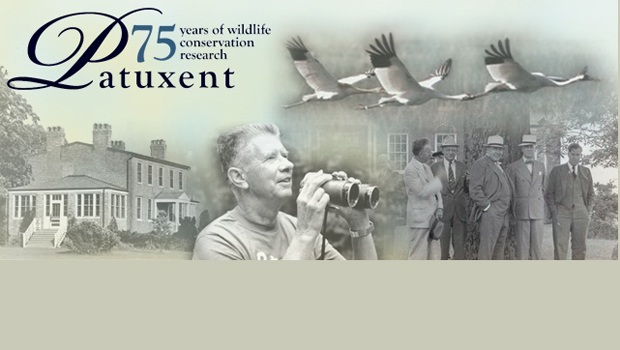
Join us in learning about wildlife conservation research with Dr. Matthew Perry as we celebrate the 75th anniversary of the USGS Patuxent Wildlife Research Center. Major programs include global climate change studies, Chesapeake Bay studies, and wildlife conservation monitoring.
Glen Canyon Dam High-Flow Experiments Provide Insights for Colorado River Management.
Demand for alternative energy sources leads scientists to consider microbes as potential sources of power.
Human health, ecological health, and environmental health are closely connected. Join us to learn how USGS science contributes to our understanding of how such environmental factors affect health threats.
A new identification guide provides images and geographic distributions of diatoms, an important group of algae.
A new USGS video highlights five decades of photographic documented change in coral reef conditions in the Florida Keys.
The USGS National Wildlife Heath Center is working with state agencies in investigating the death of thousands of birds in Arkansas and Louisiana.
Combining traditional ecological knowledge with empirical studies allows the the USGS, Tribal governments, and native organizations to increase their mutual understanding of the current health of Tribal lands and waters.
Scientists have found that the fungus associated with white-nose syndrome in bats is unlike that of any known fungal skin pathogen in land mammals. It is extremely destructive to bats wing skin and may cause catastrophic imbalance in life-support processes.
Sea-ice habitats essential to polar bears would likely respond positively should more curbs be placed on global greenhouse gas emissions, according to a new modeling study published today in the journal, Nature.
Remotely triggered thermal-imagery cameras will be used in a new non-invasive way to study mange in wolves.
Landscape photos taken in the same place but many years apart reveal dramatic changes due to human and natural factors. The USGS Desert Laboratory Repeat Photography Collection, the largest archive of its kind in the world, is 50 years old.
Decreasing pH and warming temperatures are changing ocean conditions and affecting coral and algal growth in South Florida. USGS scientists are conducting field measurements to learn more.
Many coastal wetlands worldwide including several on the U.S. Atlantic coast may be more sensitive than previously thought to climate change and sea-level rise in the this century.
Efforts are underway to restore the Greater Everglades Ecosystem, which has been profoundly altered by development and water management practices. Join us on December 1st when Dr. Lynn Wingard shares USGS research that is helping restoration management agencies develop realistic and attainable restoration goals for the region.
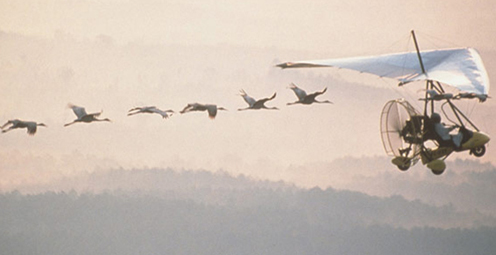
Eight specially trained whooping crane chicks hatched in May have now embarked on their first southward migration, with an ultralight airplane leading them. USGS researchers who hatched, raised, and trained the chicks at the USGS Patuxent Wildlife Research Center, are eagerly following the cranes on their journey.
Beak abnormalities, which make it difficult for birds to feed and clean themselves, are occurring in large numbers of Black-capped Chickadees, Northwestern Crows, and other species in the Pacific Northwest and may signal a growing environmental health problem.
The USGS strongly supports the national celebration of Geography Awareness Week, November 14-20, and this year’s theme: Freshwater. The “where” factor of geography integrates USGS studies in many fields of science.
Two new tools that enable the public to report sick or dead wild animals could also lead to the detection and containment of wildlife disease outbreaks that may pose a health risk to people.
USGS scientists are investigating sea turtles and their habitats in Dry Tortugas National Park to provide insight that will be used as decision-support tools for managing coral ecosystems.
Looking for information on natural resources, natural hazards, geospatial data, and more? The USGS Education site provides great resources, including lessons, data, maps, and more, to support teaching, learning, K-12 education, and university-level inquiry and research.
The Chesapeake Bay has long been an R&R destination for DC residents. However, the watershed’s overpopulation contributes to its decline. Join us when USGS’s Scott Phillips and Peter Claggett discuss new science efforts applied to restoring the Nation's largest estuary on October 6th.
Nutrient sources in both agricultural and urban areas contribute to elevated nutrient concentrations in streams and groundwater across the Nation.
The timing of animal migration and reproduction, and observing when plants send out new leaves and bear fruit, is increasingly important in understanding how climate change affects biological and hydrologic systems. Photo credit Copyright C Brandon Cole.
The USGS has been researching manatees in Florida and the Caribbean for decades, but little is known about Cuban manatees. A USGS biologist recently visited Cuba with a team of international manatee experts working to conserve manatees around the Caribbean.

USGS scientists have discovered a new turtle species, the Pearl River map turtle, found only in the Pearl River in Louisiana and Mississippi. Sea-level changes between glacial and interglacial periods over 10,000 years ago isolated the map turtles, causing them to evolve into unique species.
USGS scientists help land managers determine if fire is the appropriate strategy for controlling or enhancing specific plant species.
Did you know that contaminant-ridden dust from Africa may be harming coral reefs in the Caribbean? Scientists at the USGS are examining the air in Africa and in the Caribbean to determine what kinds of nutrients, microbes, and contaminants are traveling across the ocean.
Pharmaceutical manufacturing facilities can be a significant source of pharmaceuticals in surface water. The USGS is working with water utilities to try to reduce the release of pharmaceuticals and other emerging contaminants to the environment.
The USGS Science Strategy is a comprehensive report to critically examine the USGS's major science goals and priorities for the coming decade. The USGS is moving forward with these strategic science directions in response to the challenges that our Nation's future faces and for the stewards of our Federal lands.
Washington, D.C., is a unique city full of landmarks and buildings that are recognizable worldwide. But how were these stone giants built? Read more
As Halloween approaches and hibernation nears, these animals of the night sky face an uncertain future. Read more
USGS vigilant for West Nile virus in wildlife through surveillance, research, and mapping.

Dust storms July 21-22 blinded motorists, grounded flights and knocked out electricity. What’s causing the dust storms?
Please comment on the USGS’ draft science strategies! Read more
While on your spring hike, beware of hitchhiking ticks—they may carry Lyme Disease.
For the first time since its discovery, White-nose syndrome has been found in the West.
The family picnic: food and fun...until unwanted guests show up! Learn what you can do to prevent West Nile virus from infecting your loved ones.
Timing is everything! Consider helping track changes in spring’s arrival
Flood Safety Awareness Week is March. 12-16. What can you do to prepare?
National Groundwater Awareness Week is Mar. 11-17, 2012. See how USGS science is connecting groundwater and surface water.
Since Japan’s March 11, 2011, Tohoku earthquake and subsequent tsunami, scientists at the USGS have learned much to help better prepare for a large earthquake in the United States.
Five USGS employees honored with Distinguished Service Awards for their service to the nation
It’s National Invasive Species Awareness Week. Did you know invasive species cost our country more than 100 billion dollars each year? Get to know America’s ten top invaders this week.
Groundwater in aquifers on the East Coast and in the Central U.S. has the highest risk of contamination from radium, a naturally occurring radioactive element and known carcinogen.
The proposed USGS budget reflects research priorities to respond to nationally relevant issues, including water quantity and quality, ecosystem restoration, hydraulic fracturing, natural disasters such as floods and earthquakes, and support for the National Ocean Policy, and has a large R&D component.
Four new reports examine the contaminants polycyclic aromatic hydrocarbons (PAHs) found in house dust, streams, lakes, soil, and air.
Climate science is helping to predict food shortages, identify impacts on human health, and prepare for future conditions.
It's only the beginning of their careers, but these 3 young scientists have forged ahead with innovative research at the frontiers of science. How they've transformed their fields
Oct. 9-15, 2011, is Earth Science Week, themed "Our-Ever Changing Earth," and Oct. 12, 2011, is International Day for Natural Disaster Reduction. Answers to questions posed by a changing world
By 1936, devastating losses of wildlife populations were threatening the Nation’s natural resource heritage. America's first wildlife research center
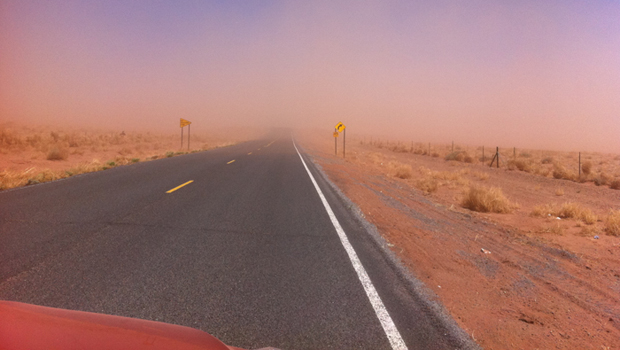
A dust storm on Tuesday, October 4, blinded motorists and caused a large string of motor vehicle crashes, multiple injuries, and at least one death. What’s causing the dust storms?
As the team of responders struggled to end the worst oil spill in our Nation’s history, USGS scientist Paul Hsieh provided the critical scientific information needed to make a crucial decision.
The movie Contagion dramatizes the scenario of a global pandemic that begins with the spread of a disease from animals to humans. What are real-life experts doing to prevent a pandemic that originates with wildlife?

On September 11, 2001, as the twin towers of the World Trade Center exploded and collapsed, clouds of dust billowed into the sky and across the city.
Forests play a significant role in removing carbon from the atmosphere by absorbing one-third of carbon emissions annually. This is according to a new U.S. Forest Service study conducted in collaboration with USGS scientists.
USGS crews continue to measure streamflow and collect water quality and sediment samples in the Ohio and Mississippi River basins using state-of-art instruments.
Ten gangly, adolescent whooping cranes have been released in Louisiana, marking a milestone for the USGS, the State of Louisiana, and the whooping cranes. The USGS has the largest breeding flock in the U.S., at about 60 birds. About half of these USGS-raised birds are returned to the wild each year.
Human health, ecological health, and environmental health are closely connected. Join us to learn how USGS science contributes to our understanding of how such environmental factors affect health threats.
Looking for information on natural resources, natural hazards, geospatial data, and more? The USGS Education site provides great resources, including lessons, data, maps, and more, to support teaching, learning, K-12 education, and university-level inquiry and research.
The Chesapeake Bay has long been an R&R destination for DC residents. However, the watershed’s overpopulation contributes to its decline. Join us when USGS’s Scott Phillips and Peter Claggett discuss new science efforts applied to restoring the Nation's largest estuary on October 6th.
USGS scientists help land managers determine if fire is the appropriate strategy for controlling or enhancing specific plant species.
Pharmaceutical manufacturing facilities can be a significant source of pharmaceuticals in surface water. The USGS is working with water utilities to try to reduce the release of pharmaceuticals and other emerging contaminants to the environment.
The United States Group on Earth Observations (USGEO) is working to connect Earth observations with public health, agriculture, climate, and data management and dissemination.
The USGS Science Strategy is a comprehensive report to critically examine the USGS's major science goals and priorities for the coming decade. The USGS is moving forward with these strategic science directions in response to the challenges that our Nation's future faces and for the stewards of our Federal lands.
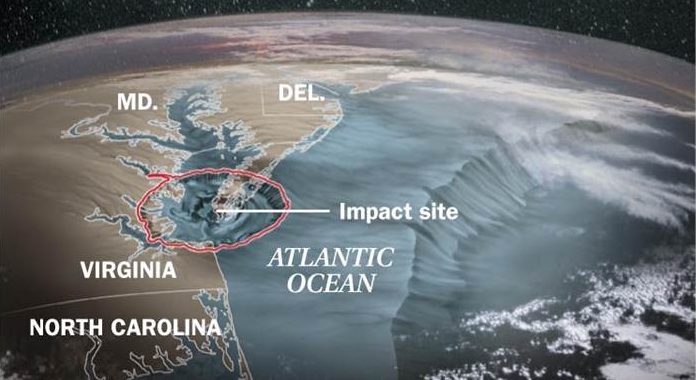
It did, 35 million years ago.
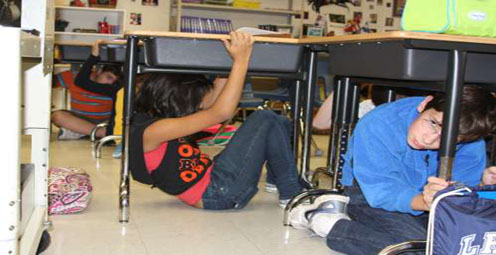
You are encouraged to participate in the Great Central U.S. ShakeOut earthquake drill to be held on Thursday, February 7, 2013. Read more
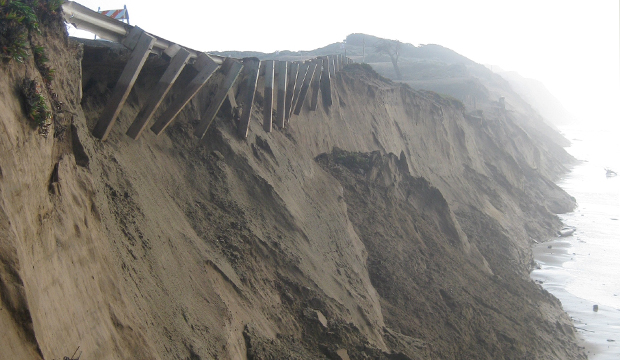
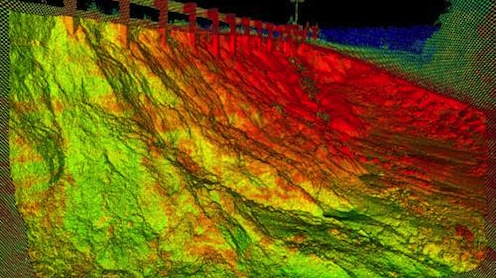
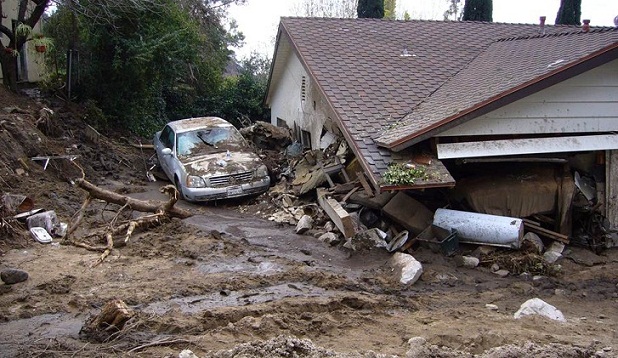
Landslides and debris flows are common and destructive geologic hazards that can happen every year in every U.S. state. Read more
The USGS is providing up-to-date information. Read more
Washington, D.C., is a unique city full of landmarks and buildings that are recognizable worldwide. But how were these stone giants built? Read more
The USGS is providing up-to-date information. Read more
The USGS is providing up-to-date information. Read more
Learn about USGS science on the processes that cause coastal change. Read more
USGS crews are out surveying the damage, recovering the sensors deployed before the storm, and collecting data that will be crucial to recovery efforts.
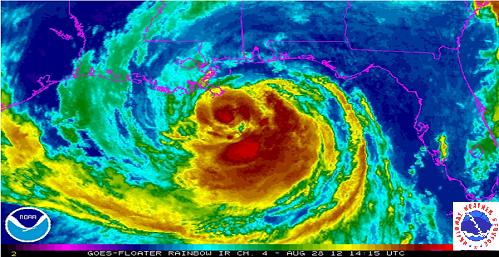
USGS is keeping careful watch as Hurricane Sandy continues to track northeast along the east coast of Florida and the Atlantic coast.
There is an urgent need for steps to mitigate earthquake risk in Burma, as it is not a question of “if” future large earthquakes will occur, but rather “when.” Read more
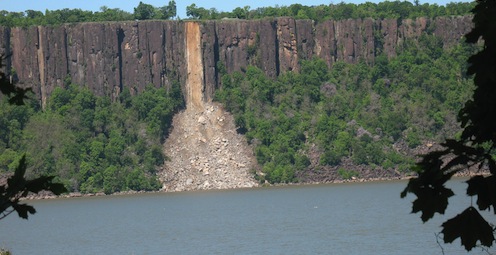
The USGS has just issued a landslide alert for parts of Maryland, Delaware, and northern Virginia. Read more
The USGS is providing up-to-date information. Read more
USGS is keeping careful watch as Hurricane Sandy continues to track northeast along the east coast of Florida and the Atlantic coast.
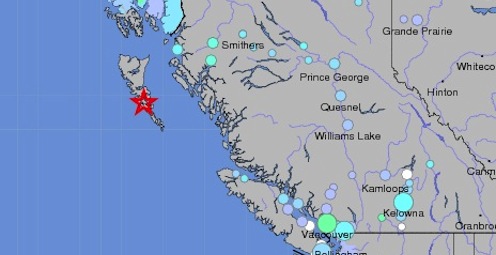
The earthquake struck off the west coast in the Pacific. The USGS is providing up-to-date information. Read more

Are you prepared for future earthquakes? Sign up and participate in a worldwide earthquake drill. Read more
Critically endangered birds whose numbers grew rapidly after successful translocations by USGS and USFWS biologists likely took a hit from the 2011 event. Read more
USGS science helps people understand and prepare for natural hazards. Read more
While Hurricane Isaac has passed, scientific work to understand the storm’s impact on Gulf Coast states continues. Read more
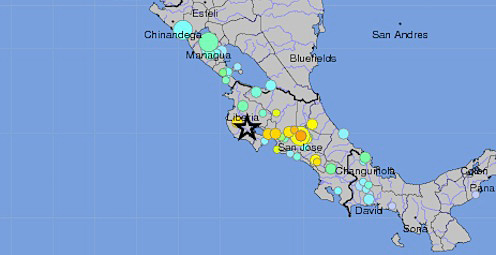
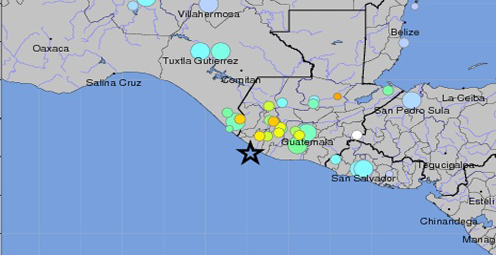
A magnitude 7.6 earthquake struck near the west coast of Costa Rica on September 5, 2012 at 14:42:10 UTC. Read more
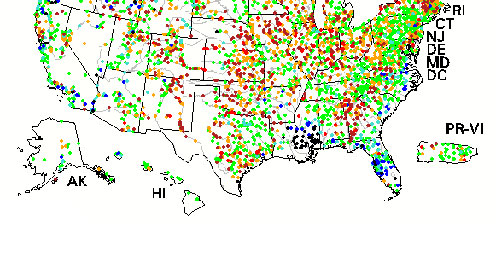
Real-time map showing the extent of flooding (black dots) and drought (red dots) in the U.S. Read more
USGS scientists, engineers, and technicians are working along the Gulf coast in response to Hurricane Isaac. Read more
USGS scientists are providing up-to-date information. Read more

The U.S. Geological Survey is keeping careful watch as Tropical Storm Isaac continues to track northwest toward the west coast of Florida and the Gulf of Mexico. Read more
It was one of the largest recorded earthquakes to occur in the east over the last century. Find out what scientists have learned in the past year. Read more
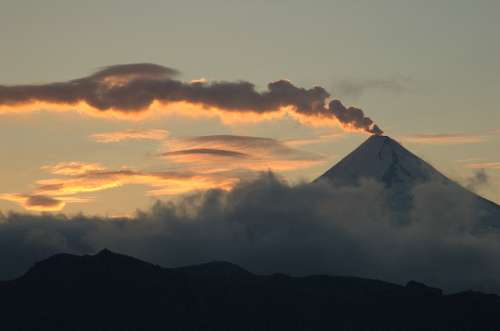
USGS scientists improve systems to monitor and forecast volcanic activity and track volcanic ash to help communities prepare. Read more
These 3 young scientists have forged ahead with innovative research at the frontiers of science. Learn more
The majority of the nation is facing dry conditions; in most areas drought conditions are expected to persist or intensify. Read more
The new “Did You See It?” website collects citizen observations of landslides. Read more
Please comment on the USGS’ draft science strategies! Read more
Citizen volunteers, portable instruments, and real-time maps help improve gathering of and access to earthquake data.Read more
The USGS and partners are designing an earthquake early warning system for California to help save lives and property.
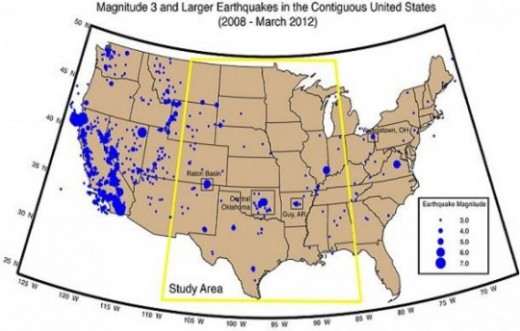
Science or Soundbite? Is the recent increase in midcontinent earthquakes natural or man-made? Find out here.
Timing is everything! Consider helping track changes in spring’s arrival
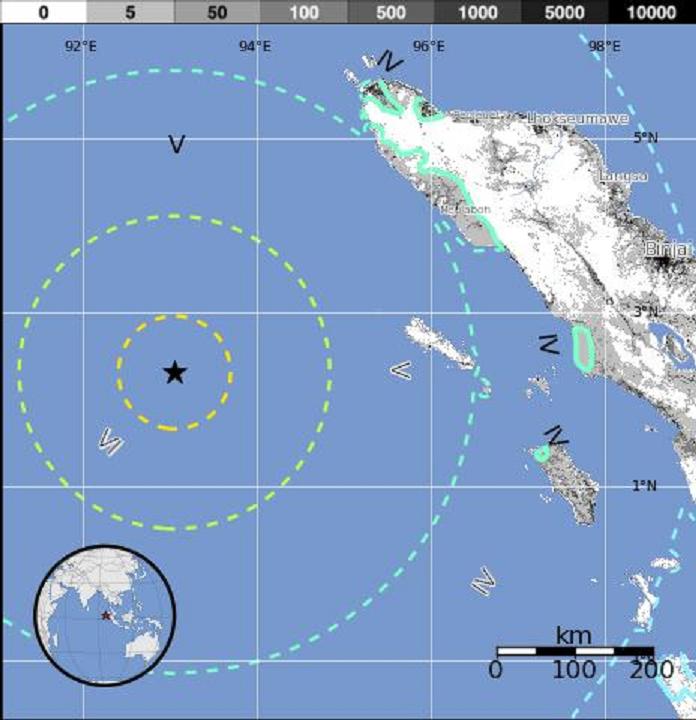
A magnitude-8.6 earthquake struck off the west coast of northern Sumatra Wednesday, April 11, 2012, at 8:38 a.m., UTC at the epicenter.
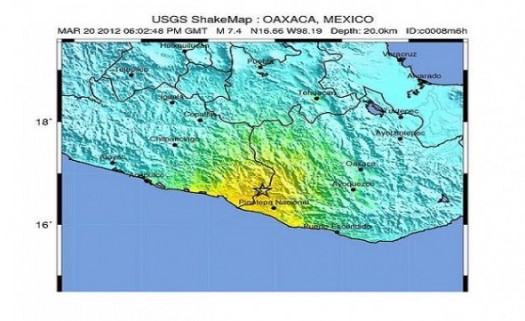
A magnitude-7.4 earthquake struck in the Mexican state of Oaxaca Tuesday, March 20, 2012, at 12:02 p.m., local time at the epicenter.
Flood Safety Awareness Week is March. 12-16. What can you do to prepare?
National Groundwater Awareness Week is Mar. 11-17, 2012. See how USGS science is connecting groundwater and surface water.
Since Japan’s March 11, 2011, Tohoku earthquake and subsequent tsunami, scientists at the USGS have learned much to help better prepare for a large earthquake in the United States.
Five USGS employees honored with Distinguished Service Awards for their service to the nation
The proposed USGS budget reflects research priorities to respond to nationally relevant issues, including water quantity and quality, ecosystem restoration, hydraulic fracturing, natural disasters such as floods and earthquakes, and support for the National Ocean Policy, and has a large R&D component.
Exploding lakes in Cameroon, Africa, have killed people and livestock. Find out how USGS science is helping prevent such an event from occurring again.
Everyone is familiar with weather systems on earth like rain, wind and snow. But space weather – variable conditions in the space surrounding Earth – has important consequences for our lives inside Earth’s atmosphere.
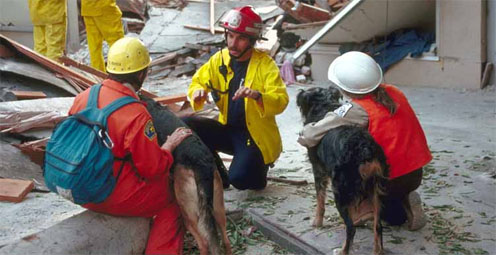
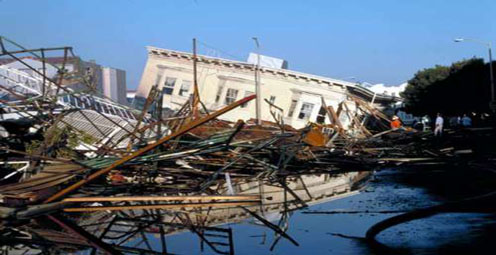
Scientists and communities are working together to make science more useful and communities safer. What one emergency manager has to say.
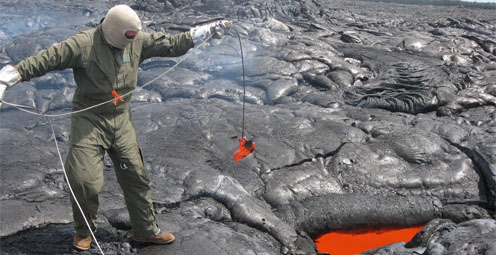
Modern volcano monitoring in the United States began with the founding of the Hawaiian Volcano Observatory in 1912. Living with volcanoes
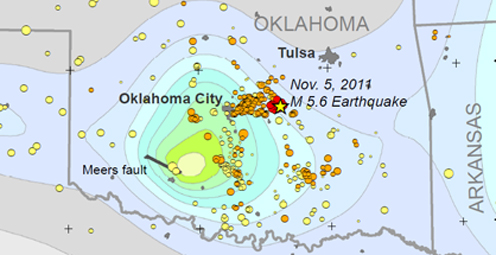
Shaking from Oklahoma's M5.6 main shock, the largest quake in the State's history, was felt from St. Louis to Lubbock. Number of quakes increasing in Oklahoma
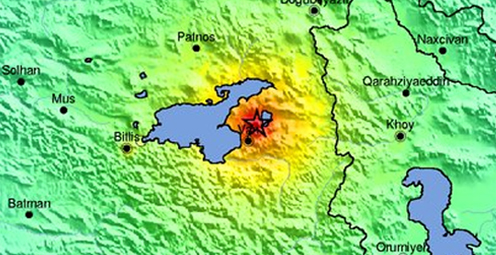
A magnitude-7.2 earthquake struck eastern Turkey on Sunday, October 23, 2011. History of strong earthquakes
It's only the beginning of their careers, but these 3 young scientists have forged ahead with innovative research at the frontiers of science. How they've transformed their fields
Oct. 9-15, 2011, is Earth Science Week, themed "Our-Ever Changing Earth," and Oct. 12, 2011, is International Day for Natural Disaster Reduction. Answers to questions posed by a changing world
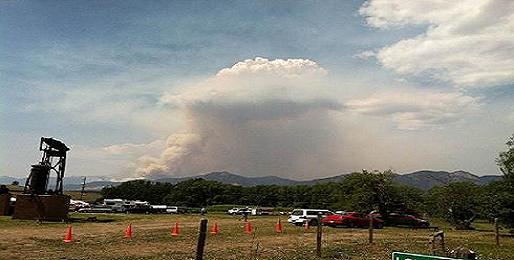
Fire managers and the public can access online maps of current wildfire locations, thanks to a Web-based mapping application provided by the USGS and its partners.
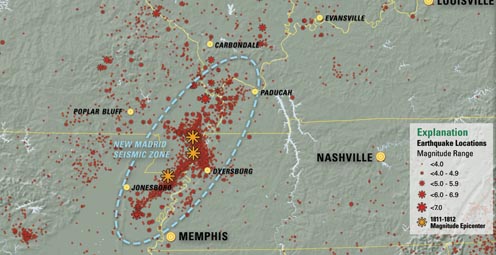
On Feb. 7, 1812, at about 3 a.m., a third, and probably most widely felt of three major earthquakes, occurred in the central Mississippi River Valley. Similar risk today.
Rivers and streams are reaching record levels as a result of Hurricane Irene’s rainfall, with more than 80 USGS streamgages measuring record peaks.
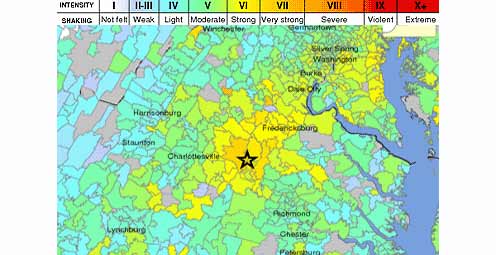
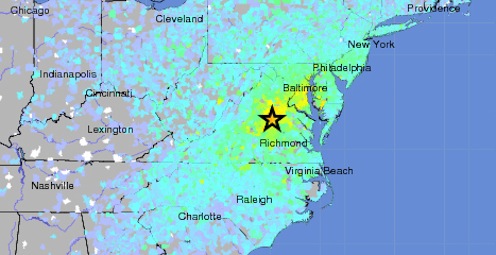
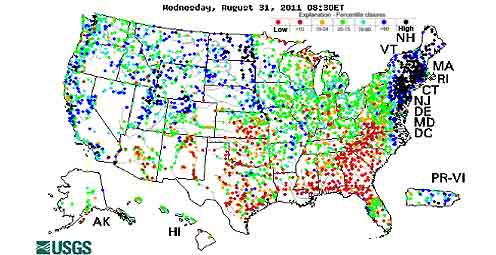
Tuesday, August 23, 2011 at 01:51 PM a 5.8 Earthquake occurred 38 miles outside of Richmond, VA.
A new geologic map of Lassen Volcanic National Park and vicinity has been created. The map area includes the entire Lassen Volcanic Center, parts of three older volcanic centers, and the products of regional volcanism.
To better understand and reduce tsunami hazards, USGS scientists examined sediment deposited by the tsunami in and around Sendai, Japan, as part of an international tsunami survey team organized by Japanese scientific cooperators.
USGS crews continue to measure streamflow and collect water quality and sediment samples in the Ohio and Mississippi River basins using state-of-art instruments.
Many communities in South Dakota, North Dakota, Montana, Colorado, Wyoming and Iowa are dealing with record floodwaters and bracing for more flooding in the upcoming weeks.
Fire managers and the public can access online maps of current wildfire locations, thanks to a web-based mapping application provided by the USGS and its partners.
New Zealand has experienced another damaging earthquake close to the city of Christchurch, which is still recovering from the magnitude-6.1 earthquake that struck in February. This latest quake has resulted in additional damage to buildings and infrastructure.
The USGS-NASA Landsat 5 satellite captured this image of 39-mile track of destruction caused by a massive tornado on June 1 near Sturbridge, MA.
As hurricane season starts, researchers are modeling potential changes to coastal environments to identify communities vulnerable to extreme erosion during storms. Data collected before and after storm landfall are used to verify past forecasts and improve future predictions.
The effects of the March 11 magnitude 9.0 earthquake and resulting tsunami on Japan are being monitored using Landsat satellite data from the USGS.

The most recent earthquake in Japan affected water levels in groundwater wells all over the country. Water level fluctuations were recorded as far away as Illinois, Virginia, Missouri and Florida.

Volcanic activity continues in the Pu`u `O`o crater on Kilauea Volcano's east rift zone and in the Halema`uma`u Crater vent at Kilauea’s summit. Visit the USGS Hawaii Volcanoes Observatory site to get detailed Kilauea and Mauna Loa activity updates, recent volcano photos, recent earthquakes, and more.
Scientists unveil a catastrophic winter storm scenario that could possibly overwhelm California's flood protection system, and significantly disrupt Statewide social and economic systems.
Heavy rainfall could potentially destabilize hillsides. The USGS Landslide Hazards Web site has what you need to know if you live in an area prone to landslides.
The USGS and the National Weather Service have developed a new flood inundation map tool that enables management officials and residents to see where the potential threat of flooding is the highest along the Flint River near Albany, Georgia.

Volcanic eruptions have always been a part of human history; the American experience is no exception. On November 3rd, USGS’s Dr. John Eichelberger discusses new USGS programs which establish monitoring networks on all hazardous US volcanoes, to reduce the effects of volcanic hazards on communities.
Kilauea is Hawaii's youngest volcano and one of the world's most active. Get daily updates on ongoing eruptions from Kilauea's summit and east rift zone.
Looking for information on natural resources, natural hazards, geospatial data, and more? The USGS Education site provides great resources, including lessons, data, maps, and more, to support teaching, learning, K-12 education, and university-level inquiry and research.
The USGS PAGER system (Prompt Assessment of Global Earthquakes for Response) will now include estimated economic loss and casualty information. This system is used by emergency responders, government and aid officials, and the public to understand the scope of the disaster to develop the best response.
Flash flooding is one of the major causes of natural hazard-related deaths in the United States and is hard to predict, but data collected by the USGS is crucial to formulating better predictive models.
The USGS Science Strategy is a comprehensive report to critically examine the USGS's major science goals and priorities for the coming decade. The USGS is moving forward with these strategic science directions in response to the challenges that our Nation's future faces and for the stewards of our Federal lands.
Manatees are often used as sentinels for emerging threats to the ocean environment and human health. Read more
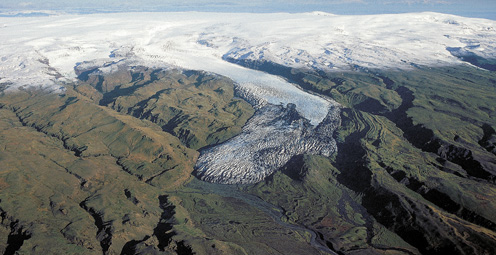
The extent and distribution of the world’s ice, primarily in the form of glaciers, provide insight about changes in the Earth’s climate and changes in sea-level. Read more
Washington, D.C., is a unique city full of landmarks and buildings that are recognizable worldwide. But how were these stone giants built? Read more
In honor of Earth Science Week the USGS is taking a look back into history at the scientists who laid the foundation for the innovative earth science research taking place today. Read more
The majority of the nation is still experiencing abnormally dry conditions, even after soaking rains from Isaac. Read more
While Hurricane Isaac has passed, scientific work to understand the storm’s impact on Gulf Coast states continues. Read more
Real-time map showing the extent of flooding (black dots) and drought (red dots) in the U.S. Read more
USGS scientists, engineers, and technicians are working along the Gulf coast in response to Hurricane Isaac. Read more
The U.S. Geological Survey is keeping careful watch as Tropical Storm Isaac continues to track northwest toward the west coast of Florida and the Gulf of Mexico. Read more
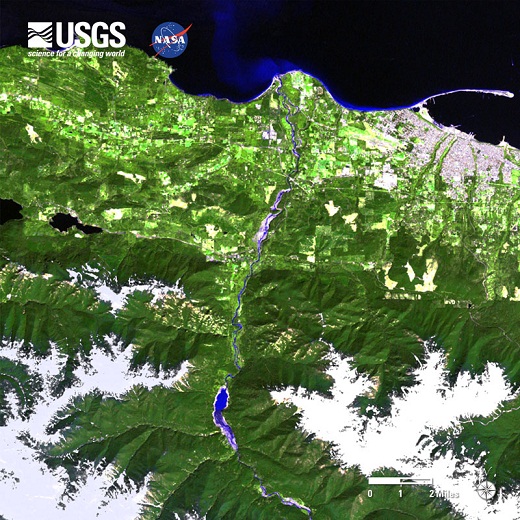
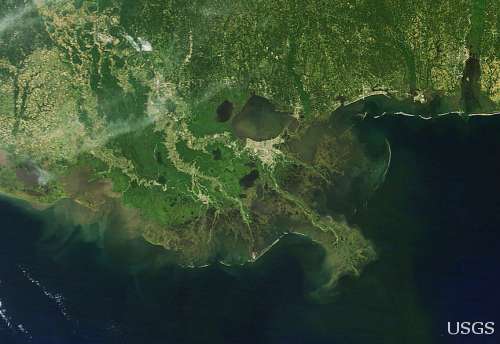
Fifteen years of data illuminate complex interactions driving land change in Puerto Rico. Read more
USGS scientists look to see if water quality is improving. Read more
The majority of the nation is facing dry conditions; in most areas drought conditions are expected to persist or intensify. Read more
Kati is a USGS student employee studying water and traveling the California coast. Read more
This year, a large dead zone again threatens the Gulf of Mexico. Read more
Please comment on the USGS’ draft science strategies! Read more
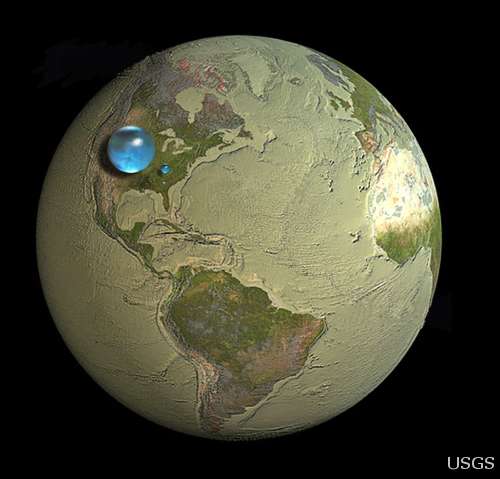
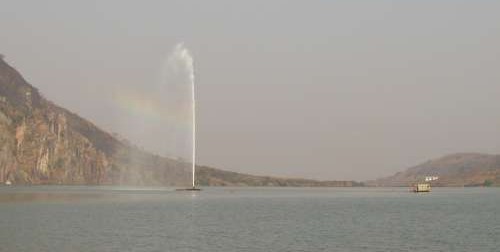
Are you surprised the water bubbles look so small? Read more
USGS Details how climate change could affect water availability in 14 U.S. Basins. Read more
Travis Gibson shares insight into the life a USGS hydrologic technician for one of the USGS water science centers out west. Read more
The USGS plays an integral role in the new U.S. Water Partnership, which will bring together public and private resources to address water challenges around the world.
Timing is everything! Consider helping track changes in spring’s arrival
Meet one of the next generation of USGS physical scientists.
Flood Safety Awareness Week is March. 12-16. What can you do to prepare?
National Groundwater Awareness Week is Mar. 11-17, 2012. See how USGS science is connecting groundwater and surface water.
Since Japan’s March 11, 2011, Tohoku earthquake and subsequent tsunami, scientists at the USGS have learned much to help better prepare for a large earthquake in the United States.
Five USGS employees honored with Distinguished Service Awards for their service to the nation
Meet a member of the next generation of USGS hydrologic technicians.
Meet a member of the next generation of USGS hydrologic technicians.
It’s National Invasive Species Awareness Week. Did you know invasive species cost our country more than 100 billion dollars each year? Get to know America’s ten top invaders this week.
Groundwater in aquifers on the East Coast and in the Central U.S. has the highest risk of contamination from radium, a naturally occurring radioactive element and known carcinogen.
The proposed USGS budget reflects research priorities to respond to nationally relevant issues, including water quantity and quality, ecosystem restoration, hydraulic fracturing, natural disasters such as floods and earthquakes, and support for the National Ocean Policy, and has a large R&D component.
Four new reports examine the contaminants polycyclic aromatic hydrocarbons (PAHs) found in house dust, streams, lakes, soil, and air.
Exploding lakes in Cameroon, Africa, have killed people and livestock. Find out how USGS science is helping prevent such an event from occurring again.
A summer intern turned permanent employee discusses his career path. Most memorable moment
Oct. 9-15, 2011, is Earth Science Week, themed "Our-Ever Changing Earth," and Oct. 12, 2011, is International Day for Natural Disaster Reduction. Answers to questions posed by a changing world
As the team of responders struggled to end the worst oil spill in our Nation’s history, USGS scientist Paul Hsieh provided the critical scientific information needed to make a crucial decision.
After years of planning, the Department of the Interior has begun removing two dams on the Elwha River in Washington. But how will the removal of these dams impact the river’s sediments, waters, and fish?
As a nation, we use more than 75 billion gallons of groundwater each day. September 13 is the National Groundwater Association’s “Protect Your Groundwater Day.” What we can do to ensure we continue to have enough of it?
USGS scientists are working to characterize the contaminants and habitats for a number of aquatic species along the lower Columbia River.
The effects of drought are felt throughout the United States and the world, and USGS science has a prominent role in understanding the causes and consequences of this hydrological phenomenon.
USGS crews continue to measure streamflow and collect water quality and sediment samples in the Ohio and Mississippi River basins using state-of-art instruments.
Many communities in South Dakota, North Dakota, Montana, Colorado, Wyoming and Iowa are dealing with record floodwaters and bracing for more flooding in the upcoming weeks.
The most recent earthquake in Japan affected water levels in groundwater wells all over the country. Water level fluctuations were recorded as far away as Illinois, Virginia, Missouri and Florida.

Groundwater is one of our most vital natural resources. The USGS studies the quantity and quality of the nation's groundwater. Learn about USGS research in an aquifer near you.
Learn how 3-D modeling is used to examine groundwater and how this cutting edge science is used to solve tomorrow's problems today.
The Great Lakes are the largest freshwater system on Earth. However the basin has the potential for local shortages, according to a new basin-wide water availability assessment by the USGS.
The Department of the Interior has established a new website to find and share websites that provide water conservation and sustainability information.
The USGS is providing information on arsenic levels at the town level in Maine to protect human health and further promote citizen participation in State well-testing programs.
Water Security is the protection of adequate water supplies for food, fiber, industrial, and residential needs for expanding populations, which requires maximizing water-use efficiency, developing new supplies, and protecting water reserves in event of scarcity due to natural, manmade, or technological hazards.
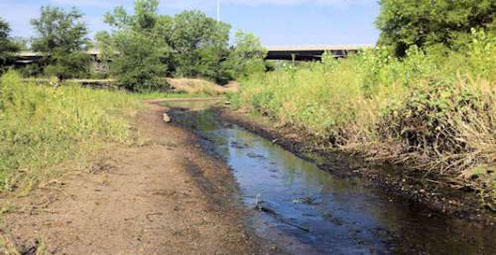
Decreases in stream flow, which are often caused by human activities, affect the integrity of aquatic life in streams, according to a new USGS study.
The USGS and the National Weather Service have developed a new flood inundation map tool that enables management officials and residents to see where the potential threat of flooding is the highest along the Flint River near Albany, Georgia.
Looking for information on natural resources, natural hazards, geospatial data, and more? The USGS Education site provides great resources, including lessons, data, maps, and more, to support teaching, learning, K-12 education, and university-level inquiry and research.
The Chesapeake Bay has long been an R&R destination for DC residents. However, the watershed’s overpopulation contributes to its decline. Join us when USGS’s Scott Phillips and Peter Claggett discuss new science efforts applied to restoring the Nation's largest estuary on October 6th.
The "Flood and high flow" map shows the location of streamgages where the water level is currently above or near flood stage. Find out what rivers and creeks near you are doing.
Nutrient sources in both agricultural and urban areas contribute to elevated nutrient concentrations in streams and groundwater across the Nation.
USGS is playing a critical role in the federal government's coordinated Deepwater Horizon response efforts.
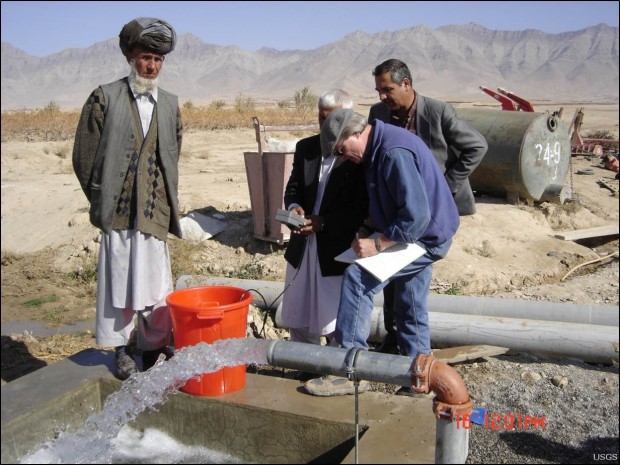
Population growth in the Kabul Basin, Afghanistan, due in part to returning refugees, is estimated to lead to a six-fold increase in drinking water needs by 2057. The USGS has worked in partnership with the Afghanistan Geological Survey to address questions of future water availability.
Flash flooding is one of the major causes of natural hazard-related deaths in the United States and is hard to predict, but data collected by the USGS is crucial to formulating better predictive models.
Did you know that contaminant-ridden dust from Africa may be harming coral reefs in the Caribbean? Scientists at the USGS are examining the air in Africa and in the Caribbean to determine what kinds of nutrients, microbes, and contaminants are traveling across the ocean.
Pharmaceutical manufacturing facilities can be a significant source of pharmaceuticals in surface water. The USGS is working with water utilities to try to reduce the release of pharmaceuticals and other emerging contaminants to the environment.
The United States Group on Earth Observations (USGEO) is working to connect Earth observations with public health, agriculture, climate, and data management and dissemination.
The USGS Science Strategy is a comprehensive report to critically examine the USGS's major science goals and priorities for the coming decade. The USGS is moving forward with these strategic science directions in response to the challenges that our Nation's future faces and for the stewards of our Federal lands.

January 24th at 7 p.m. (PST) — Public Lecture information: http://online.wr.usgs.gov/calendar

7 p.m.—Public lecture (also live-streamed over the Internet)

7 p.m.—Public lecture (also live-streamed over the Internet)

7 p.m.—Public lecture (also live-streamed over the Internet)

There are now over 60,000 maps and publications for sale for only a dollar now through May 7!

The U.S. Geological Survey had a very busy 2011 — below are a few of our highlights from last year.

Join us in Reston on December 5th at 7:00pm for our free public lecture on the impacts of offshore wind energy development on migratory seabirds!

USGS wishes The Wildlife Society happy 75th Birthday and looks forward to attending their annual conference. Stop by our booth!

7 p.m.—Public lecture (also live-streamed over the Internet)

Join us for the July Public Lecture on Invasive Species!

USGS-led survey finds that national wildlife refuges rate highly with visitors.

As the climate has warmed, many plants are starting to grow leaves and bloom flowers earlier. A new study published in the journal, Nature, suggests that most field experiments may underestimate the degree to which the timing of leafing and flowering changes with global warming.

Stressed agricultural lands may be releasing less of the moisture needed to protect the breadbasket of a continent.

Spring rains in the eastern Horn of Africa are projected to begin late this year and be substantially lower than normal.

After nearly 2 years of meticulous research, academic and government scientists confirmed that the 2010 oil spill had damaged local coral ecosystems

In recognition of World Forestry Day, let’s take a glimpse at USGS science to understand the fate of forests from climate change.

Join us on March 7 to learn about bat white-nose syndrome, which has killed an estimate 5 million bats, and to discuss the profound impacts this emergent wildlife disease may have in the 21st century.
The U.S. Geological Survey had a very busy 2011 — below are a few of our highlights from last year.

Scientists have discovered an outbreak of coral disease called Montipora White Syndrome in Kāneohe Bay, Oahu. The affected coral are of the species Montipora capitata, also known as rice coral.

Perhaps some of you have already experienced a sweet holiday smooch or two under the Christmas mistletoe, enjoying this fairly old kissing ritual for people. But mistletoe is important in other vital ways: it provides essential food, cover, and nesting sites for an amazing number of critters in the United States and elsewhere.
USGS scientists will join thousands of scientists, managers, and decision makers in Boston this week to present new findings on toxics at the Society for Environmental Toxicology and Chemistry (SETAC) conference in the Hynes Convention Center, Nov. 13-17.

On Nov. 3, USGS scientists Patrick Barnard and William Ellsworth will present a public lecture in Menlo Park, CA, providing Bay Area residents information about USGS research in the San Francisco Bay Area, including recent discoveries beneath San Francisco Bay and ongoing studies to better understand earthquake probabilities and the potential hazards associated with strong ground shaking.

Meet the R/V Muskie and the R/V Kaho, the USGS Great Lakes Science Center's two newest additions to its Great Lakes research fleet!

As climate changes, it affects the timing of when leaves emerge, the amount of foliage that grows as well as the timeframe when leaves begin to fall.

How will accelerated glacial melting over the next 50 years as a result of climate change affect the unique Gulf of Alaska and Copper River coastal ecosystems? USGS scientists are studying these processes and impacts.

The U.S. Geological Survey research looked at one of the world’s largest populations of long-tail ducks and found that hundreds of thousands of these elusive birds engage in a bizarre 30-50 mile morning commute from Nantucket Sound to the Atlantic Ocean, returning each evening.

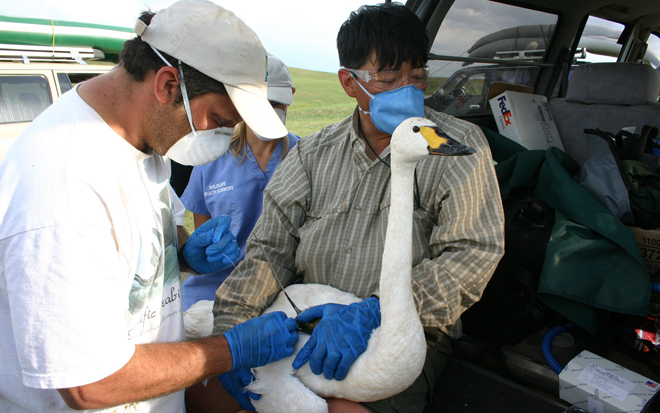
Taking advantage of USGS expertise in satellite telemetry, geospatial mapping and analysis and waterfowl migration monitoring, researchers have tracked waterfowl across Asia, Eastern Europe, and Africa and discovered new flu transmission links.

USGS is working in collaboration with numerous state and federal agencies and tribes to obtain approval for field trials with vaccine-laden, peanut-butter flavored baits and evaluate the safety and effectiveness of the vaccine in grasslands.

Psychedelically colored wolves depicted by thermal imaging will shed light on how mange affects the survival, reproduction and social behavior of wolves in Yellowstone National Park.
7 p.m.—Public lecture (also live-streamed over the Internet)
After nearly 2 years of meticulous research, academic and government scientists confirmed that the 2010 oil spill had damaged local coral ecosystems
In recognition of World Forestry Day, let’s take a glimpse at USGS science to understand the fate of forests from climate change.
Join us on March 7 to learn about bat white-nose syndrome, which has killed an estimate 5 million bats, and to discuss the profound impacts this emergent wildlife disease may have in the 21st century.
The U.S. Geological Survey had a very busy 2011 — below are a few of our highlights from last year.
Scientists have discovered an outbreak of coral disease called Montipora White Syndrome in Kāneohe Bay, Oahu. The affected coral are of the species Montipora capitata, also known as rice coral.

Recent USGS research shows that climate, vegetation, groundwater recharge rate, and proximity of the contaminants to the water table can all affect and control natural removal rates.
USGS scientists will join thousands of scientists, managers, and decision makers in Boston this week to present new findings on toxics at the Society for Environmental Toxicology and Chemistry (SETAC) conference in the Hynes Convention Center, Nov. 13-17.
On Nov. 3, USGS scientists Patrick Barnard and William Ellsworth will present a public lecture in Menlo Park, CA, providing Bay Area residents information about USGS research in the San Francisco Bay Area, including recent discoveries beneath San Francisco Bay and ongoing studies to better understand earthquake probabilities and the potential hazards associated with strong ground shaking.
Taking advantage of USGS expertise in satellite telemetry, geospatial mapping and analysis and waterfowl migration monitoring, researchers have tracked waterfowl across Asia, Eastern Europe, and Africa and discovered new flu transmission links.
USGS is working in collaboration with numerous state and federal agencies and tribes to obtain approval for field trials with vaccine-laden, peanut-butter flavored baits and evaluate the safety and effectiveness of the vaccine in grasslands.
Psychedelically colored wolves depicted by thermal imaging will shed light on how mange affects the survival, reproduction and social behavior of wolves in Yellowstone National Park.
")
February 28th at 7 p.m. (PST) — Public Lecture information: http://online.wr.usgs.gov/calendar

In response to Hurricane Isaac, USGS has deployed several hundred storm surge sensors to collect information about the effects of Isaac on the Gulf Coast.

Join us on September 5th in Reston, VA for a free public lecture on the 2011 Virginia earthquake!

Join us on August 1 to learn more about the anatomy of flooding: What are the different causes of these extreme events, and how is USGS science helping prepare residents for future foods.

Join us on June 6 for a centennial look at the greatest volcanic eruption of the 20th century at our June Public Lecture!
In recognition of World Forestry Day, let’s take a glimpse at USGS science to understand the fate of forests from climate change.

The Volcano Hazards Program announces the establishment of the USGS California Volcano Observatory (CalVO), which expands and replaces the former Long Valley Observatory.
The U.S. Geological Survey had a very busy 2011 — below are a few of our highlights from last year.
On Nov. 3, USGS scientists Patrick Barnard and William Ellsworth will present a public lecture in Menlo Park, CA, providing Bay Area residents information about USGS research in the San Francisco Bay Area, including recent discoveries beneath San Francisco Bay and ongoing studies to better understand earthquake probabilities and the potential hazards associated with strong ground shaking.

Join USGS scientists on November 2nd to discuss the seismology of the M5.8 Virginia earthquake, its effects, and its context in the geology of Virginia.
February 28th at 7 p.m. (PST) — Public Lecture information: http://online.wr.usgs.gov/calendar
In response to Hurricane Isaac, USGS has deployed several hundred storm surge sensors to collect information about the effects of Isaac on the Gulf Coast.
7 p.m.—Public lecture (also live-streamed over the Internet)
Join us on August 1 to learn more about the anatomy of flooding: What are the different causes of these extreme events, and how is USGS science helping prepare residents for future foods.

Join us in Menlo Park for our Evening Lecture on Scanning the Seafloor with Sound!
Stressed agricultural lands may be releasing less of the moisture needed to protect the breadbasket of a continent.
The U.S. Geological Survey had a very busy 2011 — below are a few of our highlights from last year.

Over the next 10 years, the USGS plans to conduct a new assessment of water availability and use. This national Water Census will address critical aspects of recent Federal legislation, including the need to establish a national water assessment program.
Recent USGS research shows that climate, vegetation, groundwater recharge rate, and proximity of the contaminants to the water table can all affect and control natural removal rates.
USGS scientists will join thousands of scientists, managers, and decision makers in Boston this week to present new findings on toxics at the Society for Environmental Toxicology and Chemistry (SETAC) conference in the Hynes Convention Center, Nov. 13-17.
On Nov. 3, USGS scientists Patrick Barnard and William Ellsworth will present a public lecture in Menlo Park, CA, providing Bay Area residents information about USGS research in the San Francisco Bay Area, including recent discoveries beneath San Francisco Bay and ongoing studies to better understand earthquake probabilities and the potential hazards associated with strong ground shaking.

Rivers and streams in the United States are releasing substantially more carbon dioxide into the atmosphere than previously thought.
Meet the R/V Muskie and the R/V Kaho, the USGS Great Lakes Science Center's two newest additions to its Great Lakes research fleet!

![]() U.S. Department of the Interior |
U.S. Geological Survey
U.S. Department of the Interior |
U.S. Geological Survey
URL: www.usgs.gov/blogs/features/usgs_top_story/start-with-science-to-address-vulnerable-coastal-communities/
Page Contact Information: Ask USGS
Page Last Modified: September 14, 2011