Science Features
 Loading Page...

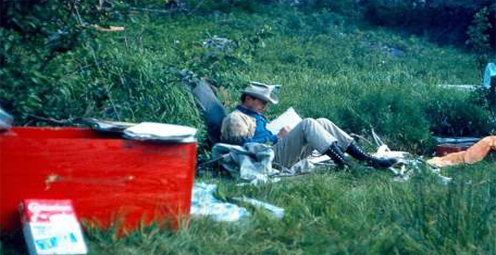
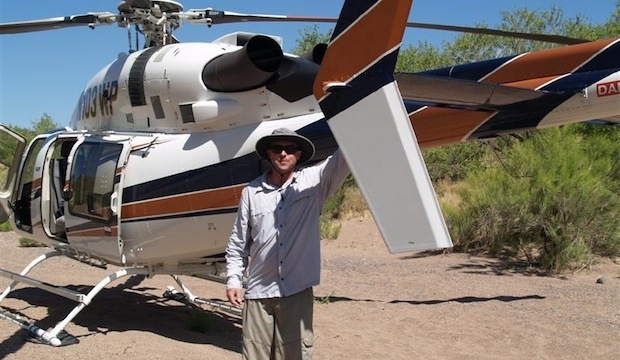
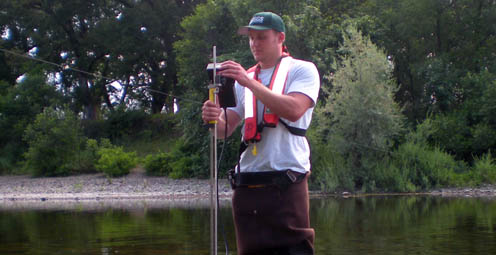
USGS hydrographer deploying a storm-surge sensor prior to Hurricane Rita
In response to Hurricane Sandy, USGS has deployed several hundred storm surge sensors to collect information about the effects of Sandy on the Atlantic Coast. Here are some frequently asked questions about these important sensors:
1. What is this program? The USGS has developed a mobile network of rapidly, deployable experimental instruments with which to observe and document hurricane-induced storm-surge domes as they make landfall and interact with coastal features.
2. Why are we undertaking this work? The work will enable us to compile data so that we can quantify storm-surge dynamics (wave heights, forces, speeds, and extent) for various storm conditions, topographies, ecologies, built environments, and landuses. This information will lead to better storm-surge models, more accurate flood forecasts, more effective flood-protection infrastructure, and wiser landuse policies.
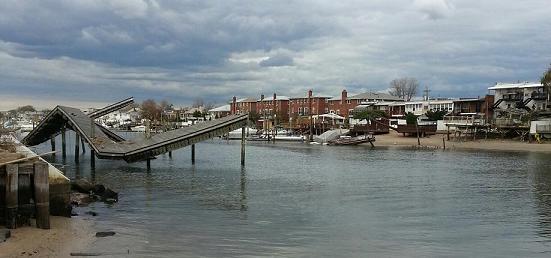
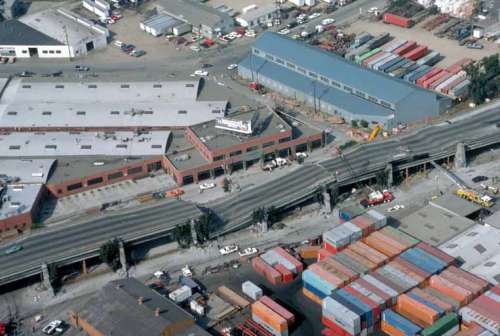
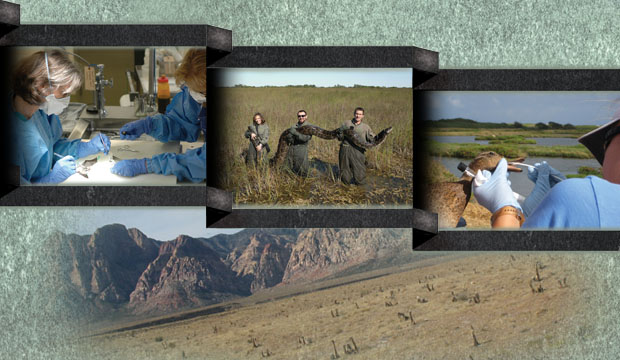
3. What is the nature of the work? About 40 to 70 storm-surge sensors (non-vented pressure transducers) are strapped to bridge piers (picture A), power and light poles, and other structures along and inland of the coast about 50 miles left and 100 miles right of the projected path of hurricane landfall. The effort involves 6 to 10 2-person teams that deploy the instruments 24 to 48 hours prior to landfall.

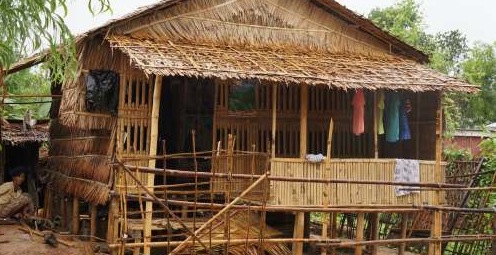
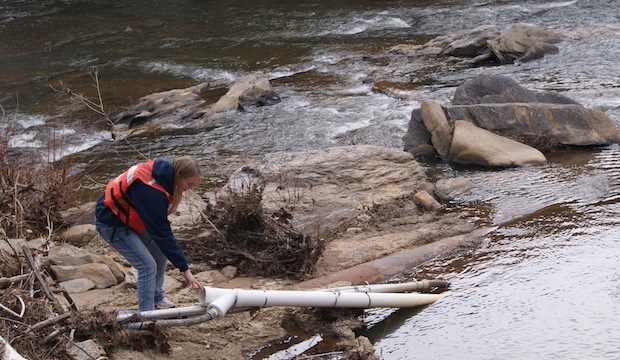
Typical storm surge sensor housing
4. What type of data do the sensors collect? Water-level (hence storm surge levels) and barometric pressure are recorded every 30 seconds for most sites. Sensors located on beaches record wave height every 2 seconds. The recording period lasts for 1 to 3 days depending on the magnitude of the storm and post-storm access to the sensor sites.
5. What do these sensors look like? They are 1-1/2” aluminum or steel pipes strapped to a piling or other stable structure. The top will have a metal or PVC cap and the bottom will be open for the water to enter. The sensor housing protects a water-level sensor inside. A unique USGS visual ID sticker will be on the outside (shown below). They may be yellow or aluminum in color. Please call the phone number on the sticker before doing anything.
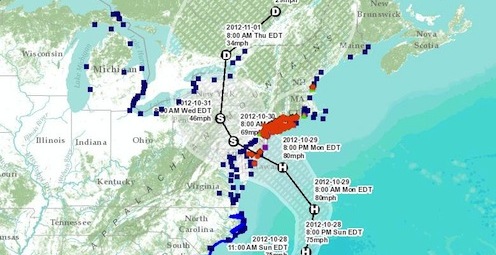
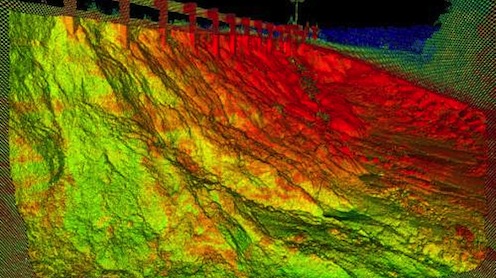
6. What are we going to do with the data? Data are uploaded to the web as stage and pressure time series. We generate various graphics to create 3-D water-surface images, and depth (picture B) and duration maps. Together they enable us to study surge flooding, including wave height, and moment by moment, visualize its interaction with the coastal features such as beaches, islands, estuaries, and streams. By tying these data together and with local topography, we can determine the rates at which flood waters transverse various water bodies and landforms, the major paths of penetration, their duration, and the height and frequency of waves that strike dunes and built infrastructure.
Data of this nature is quite rare and very valuable for determination of flood insurance maps, building codes, and for calibration of the hurricane inundation models. Accurate model forecasts are critical for community preparation of storm response and evacuation plans.

An example of a label placed on all USGS storm surge sensors
7. Are the surge data reported in real-time? The surge data are not reported in real time but are logged on-site and are not available until they are processed and calibrated for barometric pressure, water density, and elevation datums. We are experimenting with downward-looking radar devices for directly sensing surge elevation in real-time. Three such devices were deployed during Hurricane Ernesto.
8. What other kinds of data are needed? There are several kinds of data that would compliment this work and for which we seek collaborators. These include offshore water-level and wave-height data, wind speed and direction, inland water salinity, post-storm ecological assessments, and geological evaluations of beach and landform behavior, and engineering evaluations.
9. Who uses this information? Our data is used by the National Ocean and Atmospheric Administration (NOAA) National Weather Service (NWS) and National Hurricane Center (NHC) and the U.S. Army Engineer Research and Development Center (ERDC), as well as state responders and emergency management officials.
10. Where can I lean more? Reports on previous USGS storm surge documentation efforts are available online.
The USGS is providing up-to-date information. Read more
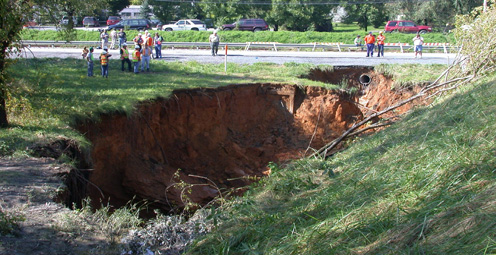
A recent devastating sinkhole in Florida has raised questions and concerns about this phenomenon. Read more
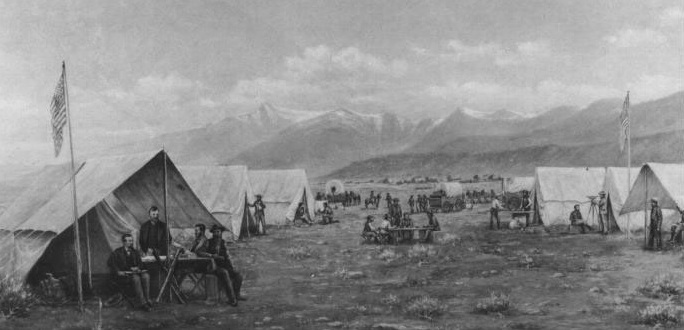
On March 3, the U.S. Geological Survey turned 134. Established by Congress in 1879 and built on a legacy of impartial science, the bureau faces unusual challenges in the near term.
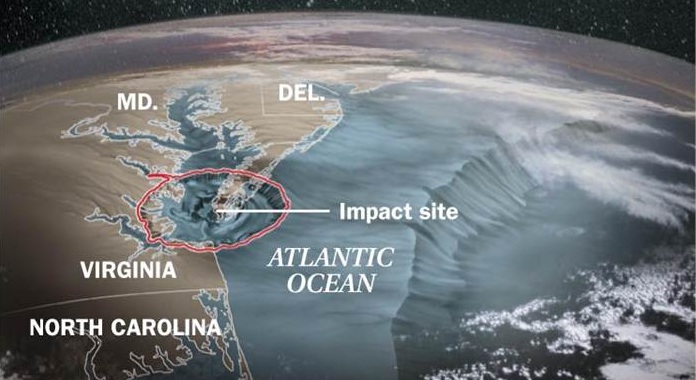
It did, 35 million years ago.
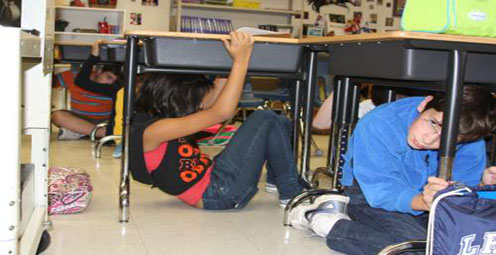
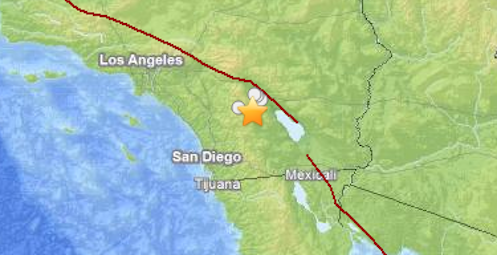
You are encouraged to participate in the Great Central U.S. ShakeOut earthquake drill to be held on Thursday, February 7, 2013. Read more
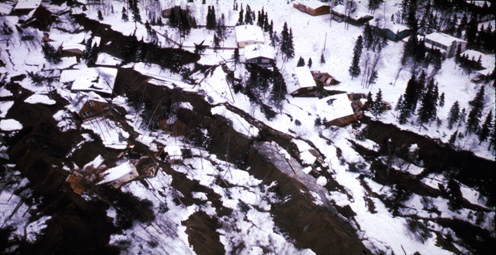
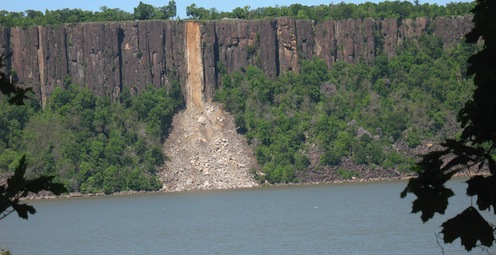
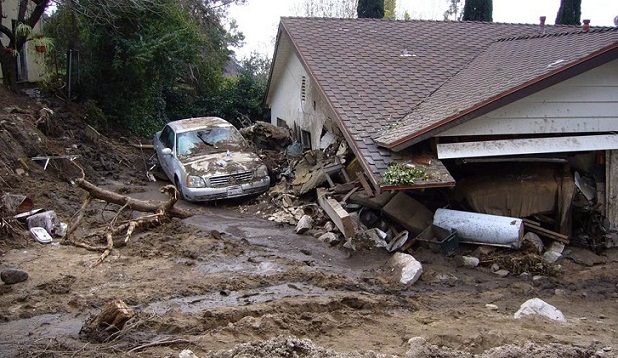
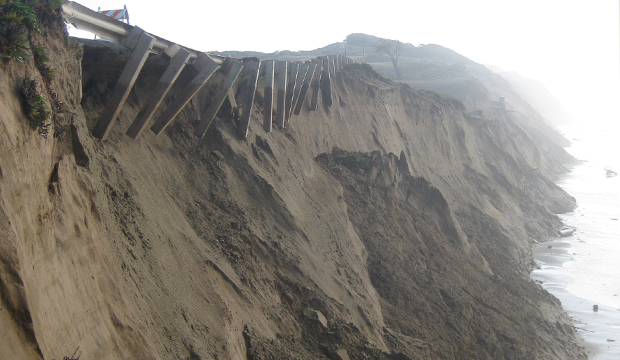
Landslides and debris flows are common and destructive geologic hazards that can happen every year in every U.S. state. Read more
The USGS is providing up-to-date information. Read more
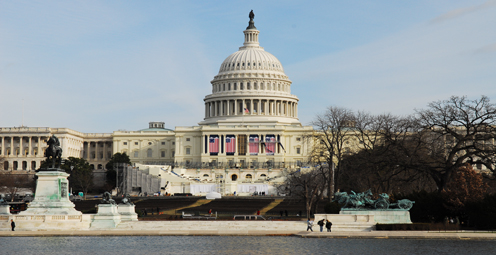
Washington, D.C., is a unique city full of landmarks and buildings that are recognizable worldwide. But how were these stone giants built? Read more
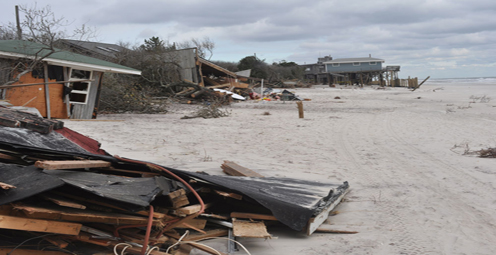
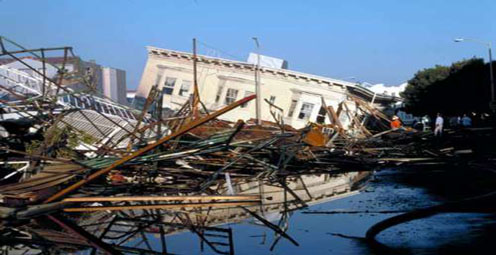
Hurricane Sandy is a stark reminder of just how essential it is for the Nation to become more resilient to coastal hazards.Read more
The USGS is providing up-to-date information. Read more
The USGS is providing up-to-date information. Read more
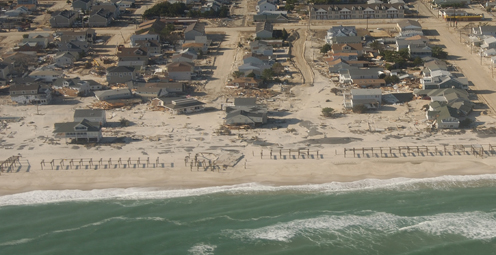
Learn about USGS science on the processes that cause coastal change. Read more
USGS crews are out surveying the damage, recovering the sensors deployed before the storm, and collecting data that will be crucial to recovery efforts.
USGS is keeping careful watch as Hurricane Sandy continues to track northeast along the east coast of Florida and the Atlantic coast.
There is an urgent need for steps to mitigate earthquake risk in Burma, as it is not a question of “if” future large earthquakes will occur, but rather “when.” Read more
The USGS has just issued a landslide alert for parts of Maryland, Delaware, and northern Virginia. Read more
The USGS is providing up-to-date information. Read more
USGS is keeping careful watch as Hurricane Sandy continues to track northeast along the east coast of Florida and the Atlantic coast.
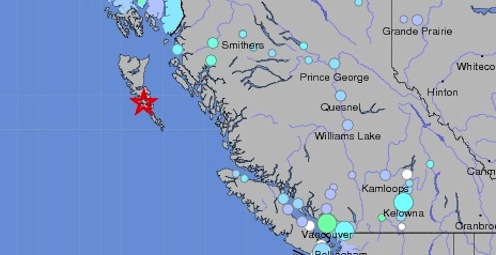
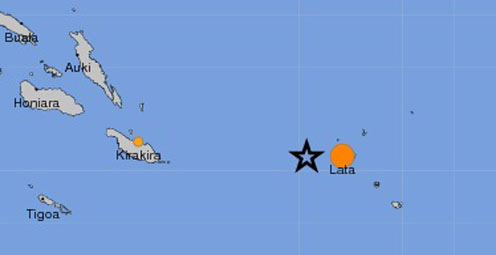
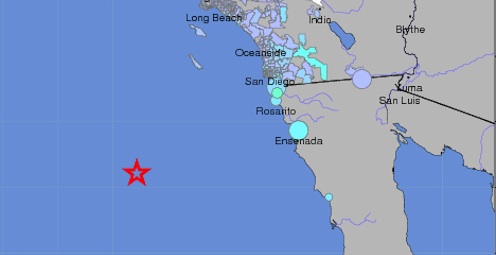
The earthquake struck off the west coast in the Pacific. The USGS is providing up-to-date information. Read more

Are you prepared for future earthquakes? Sign up and participate in a worldwide earthquake drill. Read more
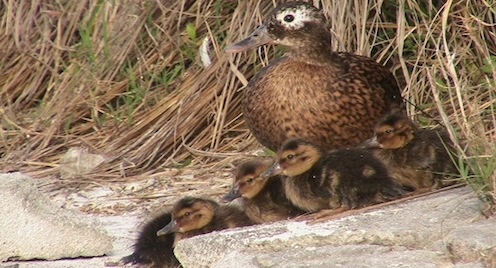
Critically endangered birds whose numbers grew rapidly after successful translocations by USGS and USFWS biologists likely took a hit from the 2011 event. Read more
USGS science helps people understand and prepare for natural hazards. Read more
While Hurricane Isaac has passed, scientific work to understand the storm’s impact on Gulf Coast states continues. Read more
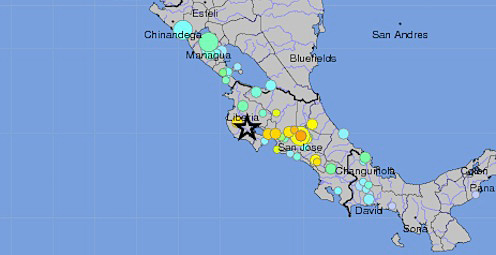
A magnitude 7.6 earthquake struck near the west coast of Costa Rica on September 5, 2012 at 14:42:10 UTC. Read more
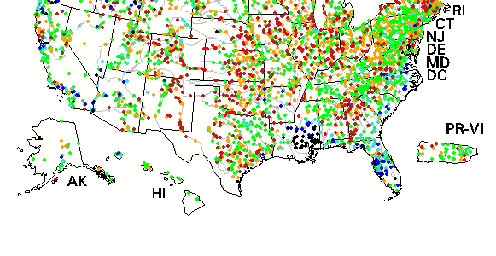
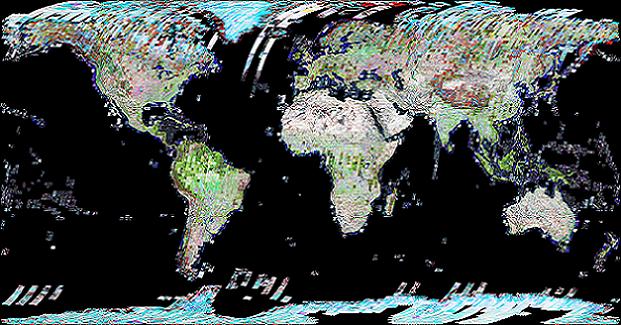
Real-time map showing the extent of flooding (black dots) and drought (red dots) in the U.S. Read more
USGS scientists, engineers, and technicians are working along the Gulf coast in response to Hurricane Isaac. Read more
USGS scientists are providing up-to-date information. Read more
The U.S. Geological Survey is keeping careful watch as Tropical Storm Isaac continues to track northwest toward the west coast of Florida and the Gulf of Mexico. Read more
It was one of the largest recorded earthquakes to occur in the east over the last century. Find out what scientists have learned in the past year. Read more
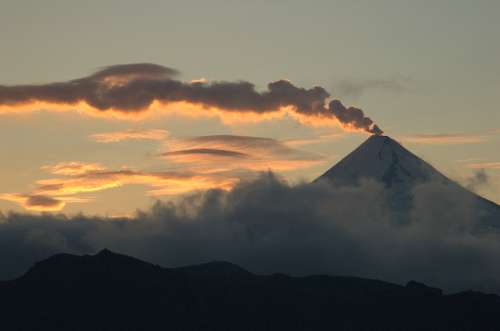
USGS scientists improve systems to monitor and forecast volcanic activity and track volcanic ash to help communities prepare. Read more
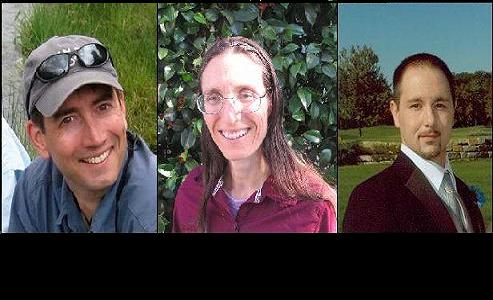
These 3 young scientists have forged ahead with innovative research at the frontiers of science. Learn more

The majority of the nation is facing dry conditions; in most areas drought conditions are expected to persist or intensify. Read more
The new “Did You See It?” website collects citizen observations of landslides. Read more
Please comment on the USGS’ draft science strategies! Read more
Citizen volunteers, portable instruments, and real-time maps help improve gathering of and access to earthquake data.Read more
The USGS and partners are designing an earthquake early warning system for California to help save lives and property.
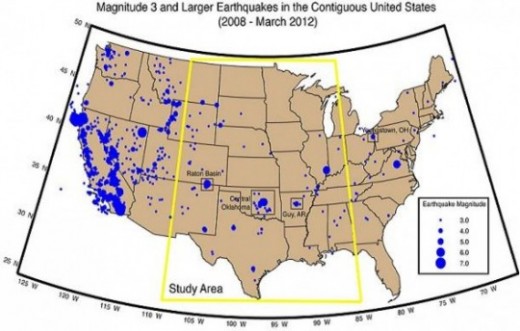
Science or Soundbite? Is the recent increase in midcontinent earthquakes natural or man-made? Find out here.
Timing is everything! Consider helping track changes in spring’s arrival
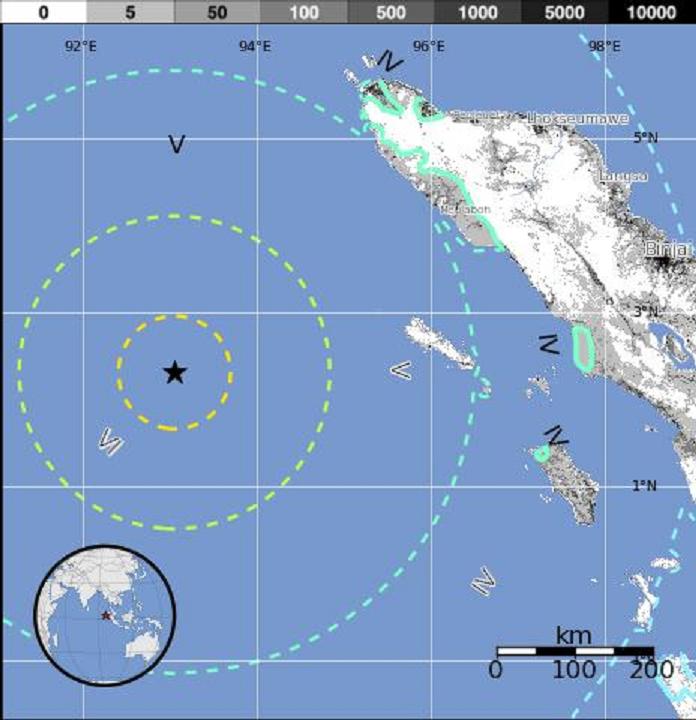
A magnitude-8.6 earthquake struck off the west coast of northern Sumatra Wednesday, April 11, 2012, at 8:38 a.m., UTC at the epicenter.
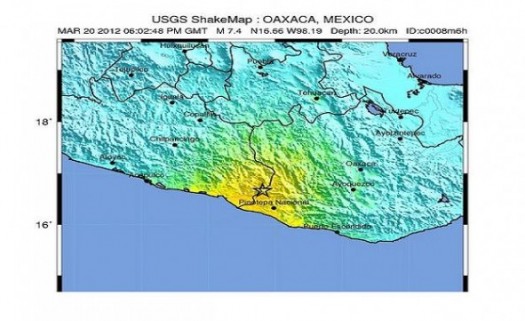
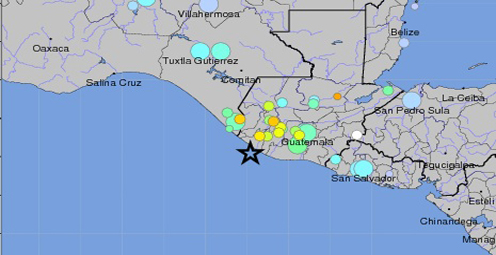
A magnitude-7.4 earthquake struck in the Mexican state of Oaxaca Tuesday, March 20, 2012, at 12:02 p.m., local time at the epicenter.
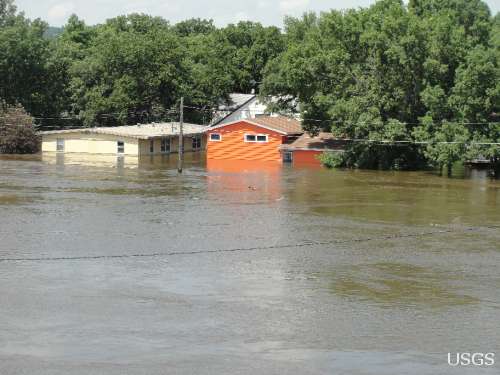
Flood Safety Awareness Week is March. 12-16. What can you do to prepare?
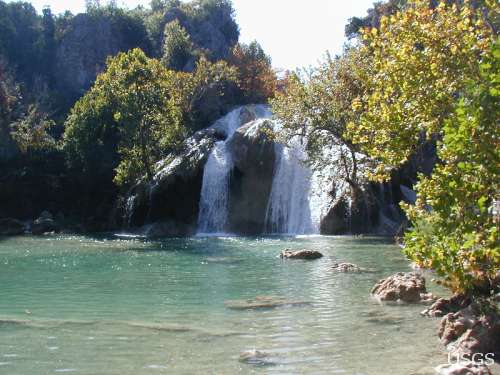
National Groundwater Awareness Week is Mar. 11-17, 2012. See how USGS science is connecting groundwater and surface water.
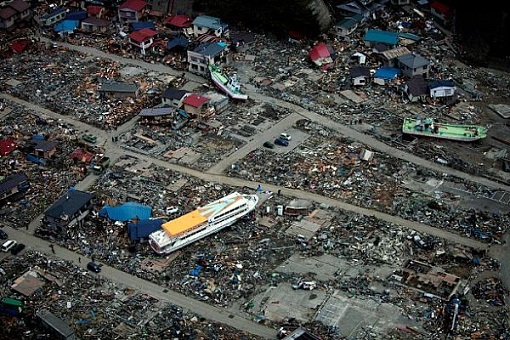
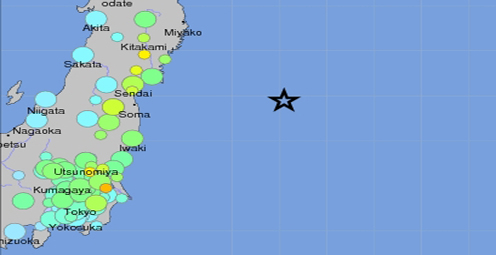
Since Japan’s March 11, 2011, Tohoku earthquake and subsequent tsunami, scientists at the USGS have learned much to help better prepare for a large earthquake in the United States.

Five USGS employees honored with Distinguished Service Awards for their service to the nation
The proposed USGS budget reflects research priorities to respond to nationally relevant issues, including water quantity and quality, ecosystem restoration, hydraulic fracturing, natural disasters such as floods and earthquakes, and support for the National Ocean Policy, and has a large R&D component.
Exploding lakes in Cameroon, Africa, have killed people and livestock. Find out how USGS science is helping prevent such an event from occurring again.

Everyone is familiar with weather systems on earth like rain, wind and snow. But space weather – variable conditions in the space surrounding Earth – has important consequences for our lives inside Earth’s atmosphere.
Scientists and communities are working together to make science more useful and communities safer. What one emergency manager has to say.
Modern volcano monitoring in the United States began with the founding of the Hawaiian Volcano Observatory in 1912. Living with volcanoes
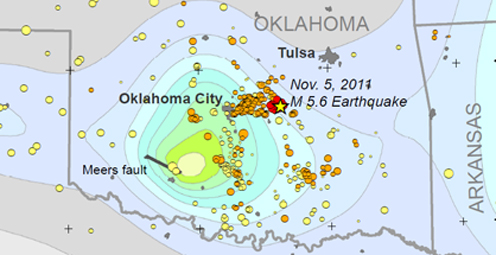
Shaking from Oklahoma's M5.6 main shock, the largest quake in the State's history, was felt from St. Louis to Lubbock. Number of quakes increasing in Oklahoma
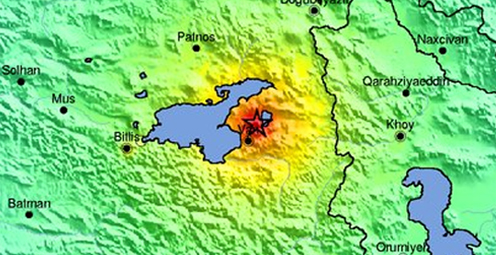
A magnitude-7.2 earthquake struck eastern Turkey on Sunday, October 23, 2011. History of strong earthquakes
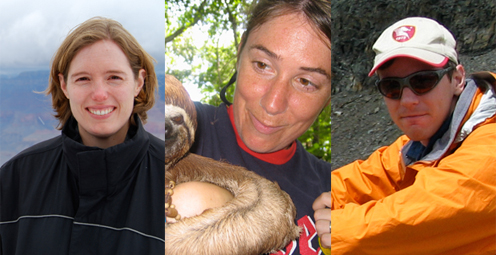
It's only the beginning of their careers, but these 3 young scientists have forged ahead with innovative research at the frontiers of science. How they've transformed their fields
Oct. 9-15, 2011, is Earth Science Week, themed "Our-Ever Changing Earth," and Oct. 12, 2011, is International Day for Natural Disaster Reduction. Answers to questions posed by a changing world
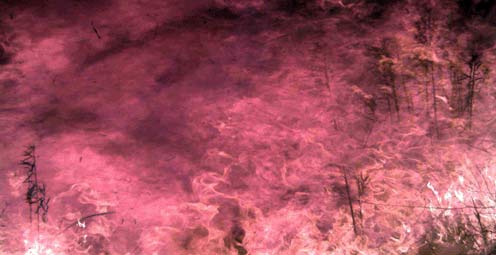
Fire managers and the public can access online maps of current wildfire locations, thanks to a Web-based mapping application provided by the USGS and its partners.
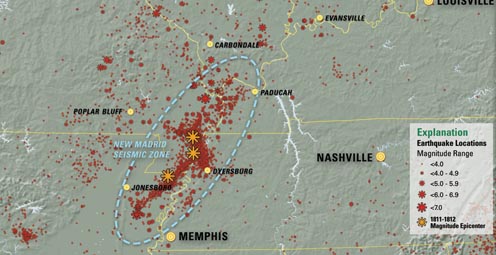
On Feb. 7, 1812, at about 3 a.m., a third, and probably most widely felt of three major earthquakes, occurred in the central Mississippi River Valley. Similar risk today.
Rivers and streams are reaching record levels as a result of Hurricane Irene’s rainfall, with more than 80 USGS streamgages measuring record peaks.
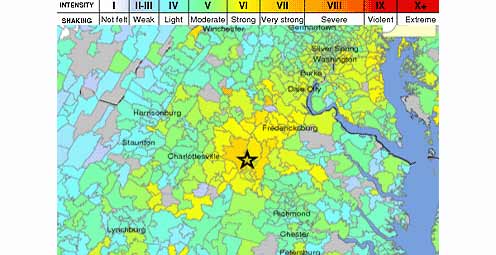
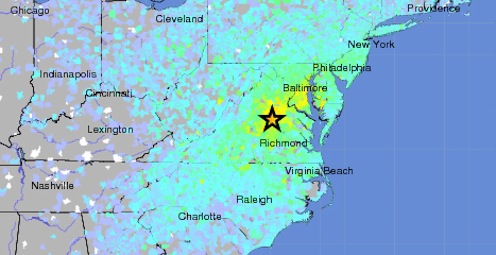
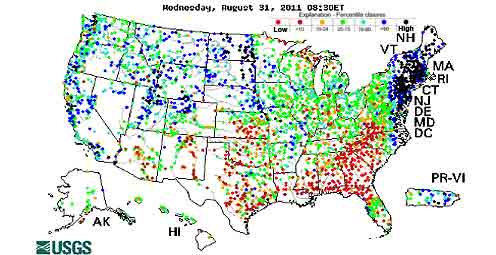
Tuesday, August 23, 2011 at 01:51 PM a 5.8 Earthquake occurred 38 miles outside of Richmond, VA.
A new geologic map of Lassen Volcanic National Park and vicinity has been created. The map area includes the entire Lassen Volcanic Center, parts of three older volcanic centers, and the products of regional volcanism.
To better understand and reduce tsunami hazards, USGS scientists examined sediment deposited by the tsunami in and around Sendai, Japan, as part of an international tsunami survey team organized by Japanese scientific cooperators.
USGS crews continue to measure streamflow and collect water quality and sediment samples in the Ohio and Mississippi River basins using state-of-art instruments.
Many communities in South Dakota, North Dakota, Montana, Colorado, Wyoming and Iowa are dealing with record floodwaters and bracing for more flooding in the upcoming weeks.
Fire managers and the public can access online maps of current wildfire locations, thanks to a web-based mapping application provided by the USGS and its partners.
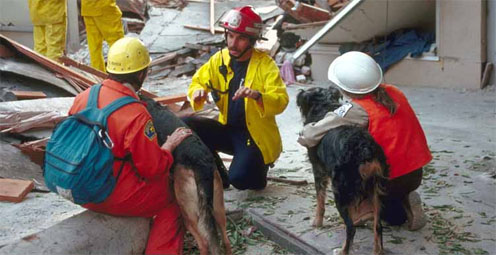
New Zealand has experienced another damaging earthquake close to the city of Christchurch, which is still recovering from the magnitude-6.1 earthquake that struck in February. This latest quake has resulted in additional damage to buildings and infrastructure.
The USGS-NASA Landsat 5 satellite captured this image of 39-mile track of destruction caused by a massive tornado on June 1 near Sturbridge, MA.
As hurricane season starts, researchers are modeling potential changes to coastal environments to identify communities vulnerable to extreme erosion during storms. Data collected before and after storm landfall are used to verify past forecasts and improve future predictions.
The effects of the March 11 magnitude 9.0 earthquake and resulting tsunami on Japan are being monitored using Landsat satellite data from the USGS.

The most recent earthquake in Japan affected water levels in groundwater wells all over the country. Water level fluctuations were recorded as far away as Illinois, Virginia, Missouri and Florida.

Volcanic activity continues in the Pu`u `O`o crater on Kilauea Volcano's east rift zone and in the Halema`uma`u Crater vent at Kilauea’s summit. Visit the USGS Hawaii Volcanoes Observatory site to get detailed Kilauea and Mauna Loa activity updates, recent volcano photos, recent earthquakes, and more.
Scientists unveil a catastrophic winter storm scenario that could possibly overwhelm California's flood protection system, and significantly disrupt Statewide social and economic systems.
Heavy rainfall could potentially destabilize hillsides. The USGS Landslide Hazards Web site has what you need to know if you live in an area prone to landslides.
The USGS and the National Weather Service have developed a new flood inundation map tool that enables management officials and residents to see where the potential threat of flooding is the highest along the Flint River near Albany, Georgia.

Volcanic eruptions have always been a part of human history; the American experience is no exception. On November 3rd, USGS’s Dr. John Eichelberger discusses new USGS programs which establish monitoring networks on all hazardous US volcanoes, to reduce the effects of volcanic hazards on communities.
Kilauea is Hawaii's youngest volcano and one of the world's most active. Get daily updates on ongoing eruptions from Kilauea's summit and east rift zone.
Looking for information on natural resources, natural hazards, geospatial data, and more? The USGS Education site provides great resources, including lessons, data, maps, and more, to support teaching, learning, K-12 education, and university-level inquiry and research.
The USGS PAGER system (Prompt Assessment of Global Earthquakes for Response) will now include estimated economic loss and casualty information. This system is used by emergency responders, government and aid officials, and the public to understand the scope of the disaster to develop the best response.
Flash flooding is one of the major causes of natural hazard-related deaths in the United States and is hard to predict, but data collected by the USGS is crucial to formulating better predictive models.
The USGS Science Strategy is a comprehensive report to critically examine the USGS's major science goals and priorities for the coming decade. The USGS is moving forward with these strategic science directions in response to the challenges that our Nation's future faces and for the stewards of our Federal lands.
USGS studies the quantity and quality of groundwater to provide consistent and integrated information needed by decision-makers.
On March 3, the U.S. Geological Survey turned 134. Established by Congress in 1879 and built on a legacy of impartial science, the bureau faces unusual challenges in the near term.
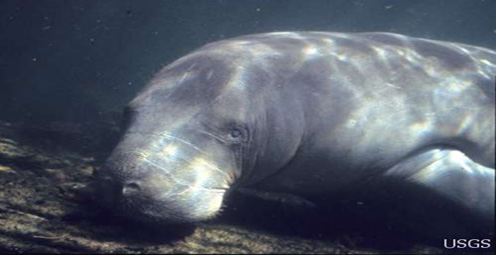
Manatees are often used as sentinels for emerging threats to the ocean environment and human health. Read more
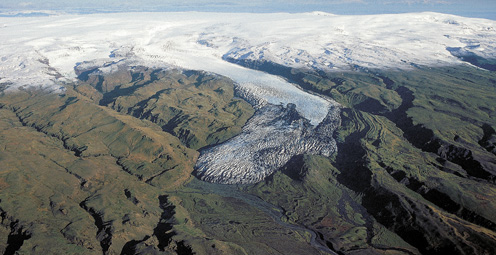
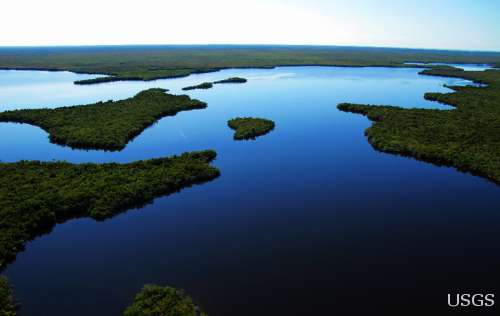
The extent and distribution of the world’s ice, primarily in the form of glaciers, provide insight about changes in the Earth’s climate and changes in sea-level. Read more
Washington, D.C., is a unique city full of landmarks and buildings that are recognizable worldwide. But how were these stone giants built? Read more
Hurricane Sandy is a stark reminder of just how essential it is for the Nation to become more resilient to coastal hazards.Read more
In honor of Earth Science Week the USGS is taking a look back into history at the scientists who laid the foundation for the innovative earth science research taking place today. Read more
The majority of the nation is still experiencing abnormally dry conditions, even after soaking rains from Isaac. Read more
While Hurricane Isaac has passed, scientific work to understand the storm’s impact on Gulf Coast states continues. Read more
Real-time map showing the extent of flooding (black dots) and drought (red dots) in the U.S. Read more
USGS scientists, engineers, and technicians are working along the Gulf coast in response to Hurricane Isaac. Read more
The U.S. Geological Survey is keeping careful watch as Tropical Storm Isaac continues to track northwest toward the west coast of Florida and the Gulf of Mexico. Read more
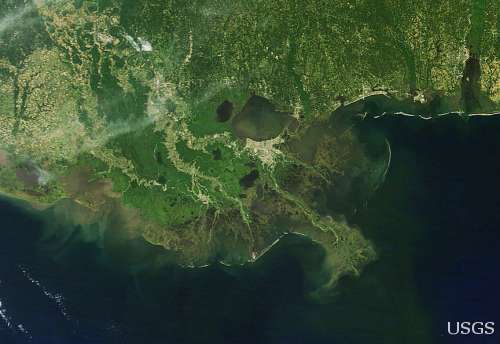
Fifteen years of data illuminate complex interactions driving land change in Puerto Rico. Read more
USGS scientists look to see if water quality is improving. Read more
The majority of the nation is facing dry conditions; in most areas drought conditions are expected to persist or intensify. Read more
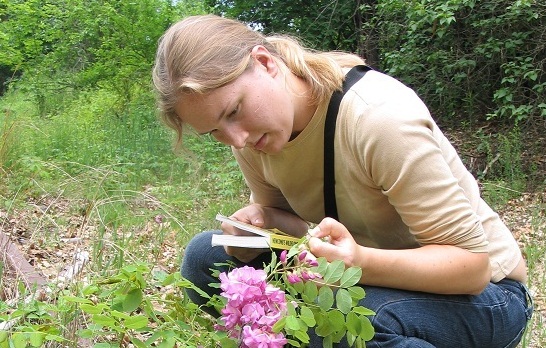
Kati is a USGS student employee studying water and traveling the California coast. Read more
This year, a large dead zone again threatens the Gulf of Mexico. Read more
Please comment on the USGS’ draft science strategies! Read more
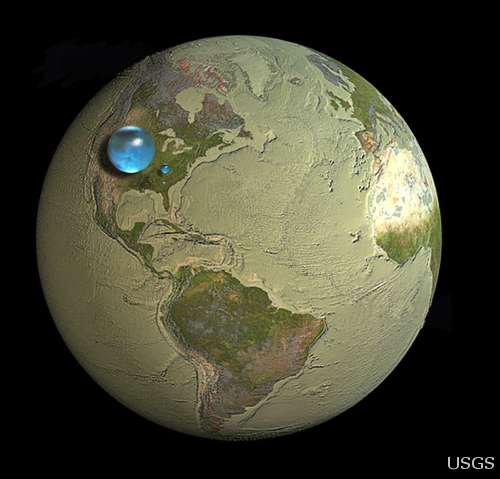
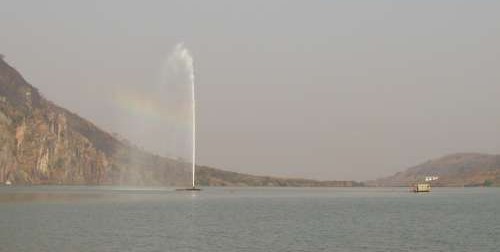
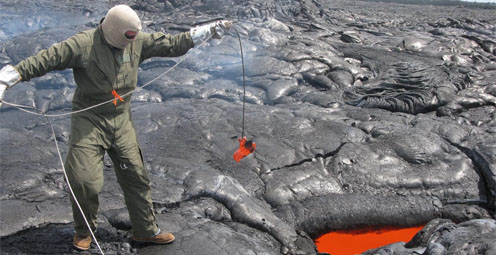
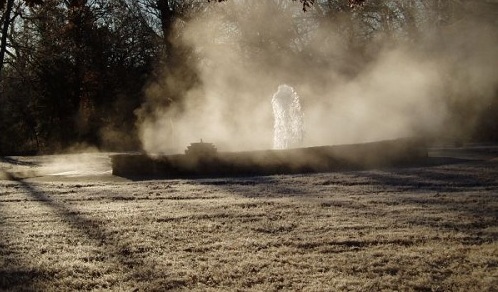
Are you surprised the water bubbles look so small? Read more
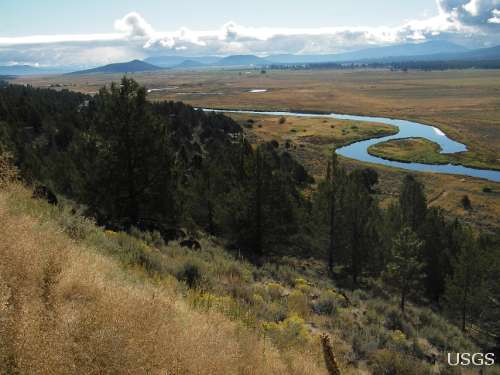
USGS Details how climate change could affect water availability in 14 U.S. Basins. Read more
Travis Gibson shares insight into the life a USGS hydrologic technician for one of the USGS water science centers out west. Read more
The USGS plays an integral role in the new U.S. Water Partnership, which will bring together public and private resources to address water challenges around the world.
Timing is everything! Consider helping track changes in spring’s arrival
Meet one of the next generation of USGS physical scientists.
Flood Safety Awareness Week is March. 12-16. What can you do to prepare?
National Groundwater Awareness Week is Mar. 11-17, 2012. See how USGS science is connecting groundwater and surface water.
Since Japan’s March 11, 2011, Tohoku earthquake and subsequent tsunami, scientists at the USGS have learned much to help better prepare for a large earthquake in the United States.
Five USGS employees honored with Distinguished Service Awards for their service to the nation
Meet a member of the next generation of USGS hydrologic technicians.
Meet a member of the next generation of USGS hydrologic technicians.
It’s National Invasive Species Awareness Week. Did you know invasive species cost our country more than 100 billion dollars each year? Get to know America’s ten top invaders this week.
Groundwater in aquifers on the East Coast and in the Central U.S. has the highest risk of contamination from radium, a naturally occurring radioactive element and known carcinogen.
The proposed USGS budget reflects research priorities to respond to nationally relevant issues, including water quantity and quality, ecosystem restoration, hydraulic fracturing, natural disasters such as floods and earthquakes, and support for the National Ocean Policy, and has a large R&D component.
Four new reports examine the contaminants polycyclic aromatic hydrocarbons (PAHs) found in house dust, streams, lakes, soil, and air.
Exploding lakes in Cameroon, Africa, have killed people and livestock. Find out how USGS science is helping prevent such an event from occurring again.
A summer intern turned permanent employee discusses his career path. Most memorable moment
Oct. 9-15, 2011, is Earth Science Week, themed "Our-Ever Changing Earth," and Oct. 12, 2011, is International Day for Natural Disaster Reduction. Answers to questions posed by a changing world
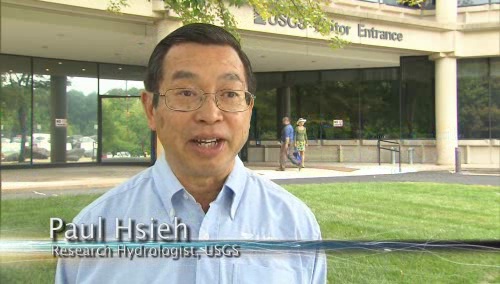
As the team of responders struggled to end the worst oil spill in our Nation’s history, USGS scientist Paul Hsieh provided the critical scientific information needed to make a crucial decision.
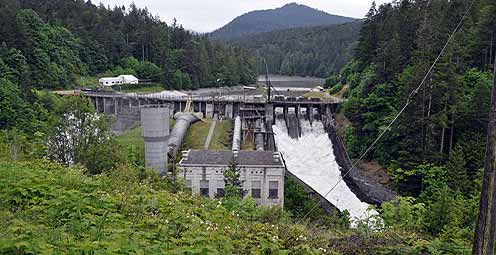
After years of planning, the Department of the Interior has begun removing two dams on the Elwha River in Washington. But how will the removal of these dams impact the river’s sediments, waters, and fish?
As a nation, we use more than 75 billion gallons of groundwater each day. September 13 is the National Groundwater Association’s “Protect Your Groundwater Day.” What we can do to ensure we continue to have enough of it?
USGS scientists are working to characterize the contaminants and habitats for a number of aquatic species along the lower Columbia River.
The effects of drought are felt throughout the United States and the world, and USGS science has a prominent role in understanding the causes and consequences of this hydrological phenomenon.
USGS crews continue to measure streamflow and collect water quality and sediment samples in the Ohio and Mississippi River basins using state-of-art instruments.
Many communities in South Dakota, North Dakota, Montana, Colorado, Wyoming and Iowa are dealing with record floodwaters and bracing for more flooding in the upcoming weeks.
The most recent earthquake in Japan affected water levels in groundwater wells all over the country. Water level fluctuations were recorded as far away as Illinois, Virginia, Missouri and Florida.

Groundwater is one of our most vital natural resources. The USGS studies the quantity and quality of the nation's groundwater. Learn about USGS research in an aquifer near you.
Learn how 3-D modeling is used to examine groundwater and how this cutting edge science is used to solve tomorrow's problems today.
The Great Lakes are the largest freshwater system on Earth. However the basin has the potential for local shortages, according to a new basin-wide water availability assessment by the USGS.
The Department of the Interior has established a new website to find and share websites that provide water conservation and sustainability information.
The USGS is providing information on arsenic levels at the town level in Maine to protect human health and further promote citizen participation in State well-testing programs.
Water Security is the protection of adequate water supplies for food, fiber, industrial, and residential needs for expanding populations, which requires maximizing water-use efficiency, developing new supplies, and protecting water reserves in event of scarcity due to natural, manmade, or technological hazards.
Decreases in stream flow, which are often caused by human activities, affect the integrity of aquatic life in streams, according to a new USGS study.
The USGS and the National Weather Service have developed a new flood inundation map tool that enables management officials and residents to see where the potential threat of flooding is the highest along the Flint River near Albany, Georgia.
Looking for information on natural resources, natural hazards, geospatial data, and more? The USGS Education site provides great resources, including lessons, data, maps, and more, to support teaching, learning, K-12 education, and university-level inquiry and research.
The Chesapeake Bay has long been an R&R destination for DC residents. However, the watershed’s overpopulation contributes to its decline. Join us when USGS’s Scott Phillips and Peter Claggett discuss new science efforts applied to restoring the Nation's largest estuary on October 6th.
The "Flood and high flow" map shows the location of streamgages where the water level is currently above or near flood stage. Find out what rivers and creeks near you are doing.
Nutrient sources in both agricultural and urban areas contribute to elevated nutrient concentrations in streams and groundwater across the Nation.
USGS is playing a critical role in the federal government's coordinated Deepwater Horizon response efforts.
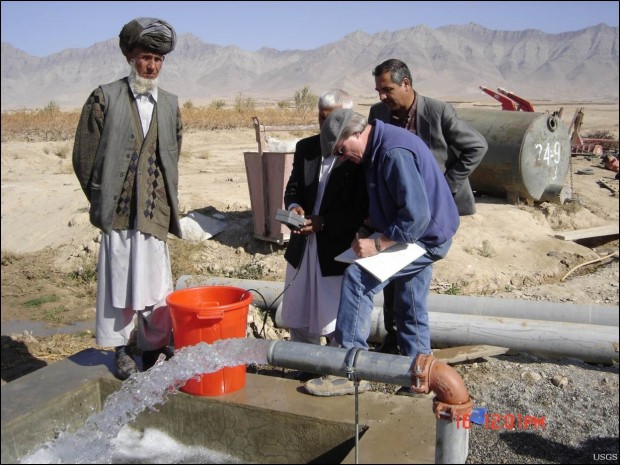
Population growth in the Kabul Basin, Afghanistan, due in part to returning refugees, is estimated to lead to a six-fold increase in drinking water needs by 2057. The USGS has worked in partnership with the Afghanistan Geological Survey to address questions of future water availability.
Flash flooding is one of the major causes of natural hazard-related deaths in the United States and is hard to predict, but data collected by the USGS is crucial to formulating better predictive models.
Did you know that contaminant-ridden dust from Africa may be harming coral reefs in the Caribbean? Scientists at the USGS are examining the air in Africa and in the Caribbean to determine what kinds of nutrients, microbes, and contaminants are traveling across the ocean.
Pharmaceutical manufacturing facilities can be a significant source of pharmaceuticals in surface water. The USGS is working with water utilities to try to reduce the release of pharmaceuticals and other emerging contaminants to the environment.
The United States Group on Earth Observations (USGEO) is working to connect Earth observations with public health, agriculture, climate, and data management and dissemination.
The USGS Science Strategy is a comprehensive report to critically examine the USGS's major science goals and priorities for the coming decade. The USGS is moving forward with these strategic science directions in response to the challenges that our Nation's future faces and for the stewards of our Federal lands.
")
February 28th at 7 p.m. (PST) — Public Lecture information: http://online.wr.usgs.gov/calendar

Join us on September 5th in Reston, VA for a free public lecture on the 2011 Virginia earthquake!

Join us on August 1 to learn more about the anatomy of flooding: What are the different causes of these extreme events, and how is USGS science helping prepare residents for future foods.

Join us on June 6 for a centennial look at the greatest volcanic eruption of the 20th century at our June Public Lecture!

In recognition of World Forestry Day, let’s take a glimpse at USGS science to understand the fate of forests from climate change.

The Volcano Hazards Program announces the establishment of the USGS California Volcano Observatory (CalVO), which expands and replaces the former Long Valley Observatory.

The U.S. Geological Survey had a very busy 2011 — below are a few of our highlights from last year.

On Nov. 3, USGS scientists Patrick Barnard and William Ellsworth will present a public lecture in Menlo Park, CA, providing Bay Area residents information about USGS research in the San Francisco Bay Area, including recent discoveries beneath San Francisco Bay and ongoing studies to better understand earthquake probabilities and the potential hazards associated with strong ground shaking.

Join USGS scientists on November 2nd to discuss the seismology of the M5.8 Virginia earthquake, its effects, and its context in the geology of Virginia.
February 28th at 7 p.m. (PST) — Public Lecture information: http://online.wr.usgs.gov/calendar

7 p.m.—Public lecture (also live-streamed over the Internet)
Join us on August 1 to learn more about the anatomy of flooding: What are the different causes of these extreme events, and how is USGS science helping prepare residents for future foods.

Join us in Menlo Park for our Evening Lecture on Scanning the Seafloor with Sound!

Stressed agricultural lands may be releasing less of the moisture needed to protect the breadbasket of a continent.
The U.S. Geological Survey had a very busy 2011 — below are a few of our highlights from last year.

Over the next 10 years, the USGS plans to conduct a new assessment of water availability and use. This national Water Census will address critical aspects of recent Federal legislation, including the need to establish a national water assessment program.

Recent USGS research shows that climate, vegetation, groundwater recharge rate, and proximity of the contaminants to the water table can all affect and control natural removal rates.
USGS scientists will join thousands of scientists, managers, and decision makers in Boston this week to present new findings on toxics at the Society for Environmental Toxicology and Chemistry (SETAC) conference in the Hynes Convention Center, Nov. 13-17.
On Nov. 3, USGS scientists Patrick Barnard and William Ellsworth will present a public lecture in Menlo Park, CA, providing Bay Area residents information about USGS research in the San Francisco Bay Area, including recent discoveries beneath San Francisco Bay and ongoing studies to better understand earthquake probabilities and the potential hazards associated with strong ground shaking.

Rivers and streams in the United States are releasing substantially more carbon dioxide into the atmosphere than previously thought.

Meet the R/V Muskie and the R/V Kaho, the USGS Great Lakes Science Center's two newest additions to its Great Lakes research fleet!

![]() U.S. Department of the Interior |
U.S. Geological Survey
U.S. Department of the Interior |
U.S. Geological Survey
URL: www.usgs.gov/blogs/features/usgs_science_pick/usgs-storm-surge-sensors/
Page Contact Information: Ask USGS
Page Last Modified: September 14, 2011