Skip Navigation
www.ahrq.gov
AHRQ Home
|
Questions?
|
Contact Us
|
Site Map
|
What's New
|
Browse
|
Información en español
|
E-mail Updates
Effective Health Care
Log In
or
Create a New Account
Search Effective Health Care
Home
Slides
Home
Tools and Resources
Research Summaries for Consumers, Clinicians, and Policymakers
Search for Research Summaries, Reviews, and Reports
Research Available for Comment
Submit a Suggestion for Research
Submit Scientific Information Packets
Comparative Effectiveness Research Grant and ARRA Awards
News and Announcements
What Is Comparative Effectiveness Research
Who Is Involved in the Effective Health Care Program
What Is the Effective Health Care Program
Site Map
Glossary of Terms
Help and Support
Contact the Effective Health Care Program
Join the E-mail List
Personalization and Social Media Tools
Viewers, Players, and Plug-ins
Slide Tray
0
slides
View
Empty
Download
Return to Slide Library
Slides
Search Slides
Add Presentation to Slide Tray
Presentation:
Presentation of Findings
Authors:
Joseph Lau, M.D., Melissa L. McPheeters, Ph.D., M.P.H., Jeff Seroogy, B.S., Thomas Trikalinos, M.D., Ph.D.
Slides: 1–12 of 31
View per page:
12
20
28
36
Add to tray
Remove from tray
Presentation of Findings
Add to tray
Remove from tray
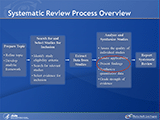
Systematic Review Process Overview
Keywords:
systematic process overview
Add to tray
Remove from tray
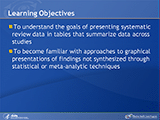
Learning Objectives
Keywords:
data tables
|
graphical presentation
Add to tray
Remove from tray
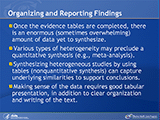
Organizing and Reporting Findings
Keywords:
analytic framework
|
key question
|
inclusion criteria
|
exclusion criteria
|
evidence table
Add to tray
Remove from tray
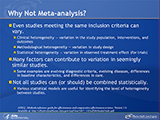
Why Not Meta-analysis?
Keywords:
heterogeneity
|
variation
|
statistical models
Add to tray
Remove from tray
Solution
Keywords:
summary table
|
heterogeneity
|
systematic review
|
Evidence-based Practice Center
Add to tray
Remove from tray
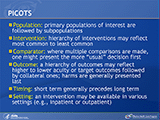
PICOTS
Keywords:
PICOTS
|
PICOS
Add to tray
Remove from tray
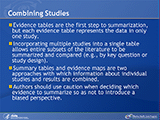
Combining Studies
Keywords:
evidence table
|
data
|
summary table
|
evidence map
Add to tray
Remove from tray
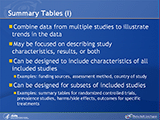
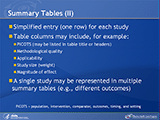
Summary Tables (I)
Keywords:
summary table
|
evidence table
Add to tray
Remove from tray
Summary Tables (II)
Keywords:
summary table
Add to tray
Remove from tray
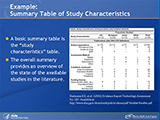
Example: Summary Table of Study Characteristics
Keywords:
summary table
|
key question
|
study design
Add to tray
Remove from tray
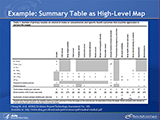
Example: Summary Table as High-Level Map
Keywords:
summary table
|
evidence map
Pages: [1]
2
3
Next
Your slide tray is being processed.


 E-mail Updates