EIA collects, analyzes, and disseminates independent and impartial energy information to promote sound policymaking, efficient markets, and public understanding of energy and its interaction with the economy and the environment.
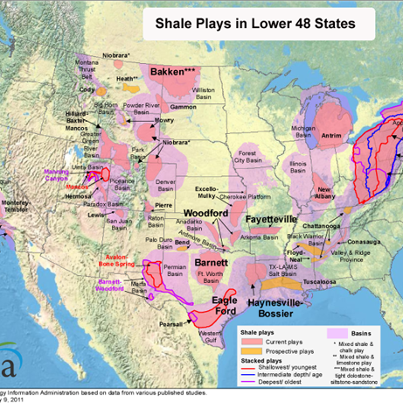
We’re officially kicking off our weekly People Are Asking series on Facebook. This week’s top question: Does EIA publish U.S. shale gas production data by play? Yes, see U.S. shale gas production graph at: http://go.usa.gov/gM4Y
Average, on-peak (weekdays from 7:00 a.m. to 11:00 p.m.) day-ahead electricity prices were lower across the entire United States in 2012 compared to 2011. In wholesale electric regions where prices declined in both 2011 and 2012, the drops in 2012 were generally larger. Lower natural gas prices in 2012 and generally mild temperatures contributed to the 2012 declines in on-peak power prices. Read more:
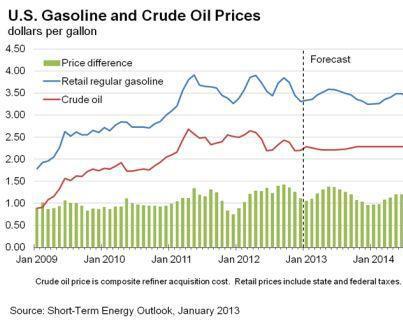
U.S. retail gasoline prices are expected to decline over the next two years. The average pump price for regular unleaded gasoline was $3.63 a gallon during 2012. That is expected to fall to $3.44 this year and then drop to $3.34 in 2014, ac...cording to EIA's latest Short-Term Energy Outlook.
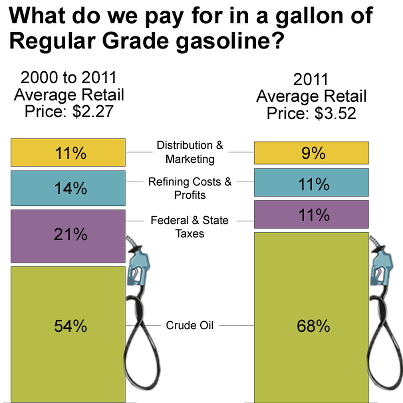
Expected lower crude oil prices, which accounted for about 66% of the price for gasoline during 2012, will contribute to savings for consumers at the pump.
At the same time, U.S. gasoline demand is expected to change little over the next two years as Americans buy more fuel-efficient vehicles and older gas guzzlers are retired. Read more: http://www.eia.gov/forecasts/steo/See More
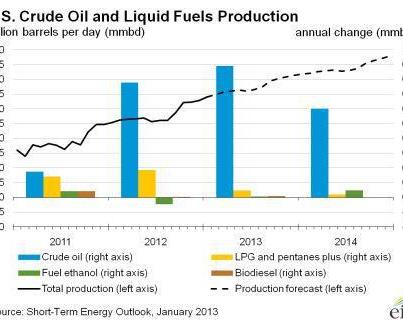
EIA’s latest Short-Term Energy Outlook (STEO) includes forecasts for 2014. U.S. crude oil production is expected to keep rising over the next two years. America’s oil output will jump nearly 900,000 barrels per day in 2013 to an average 7.3... million barrels a day. This would mark the biggest one-year increase in output since U.S. commercial crude oil production began in 1859.
U.S. daily oil production is expected to rise by another 600,000 barrels in 2014 to nearly 8 million barrels a day, the highest level since 1988.
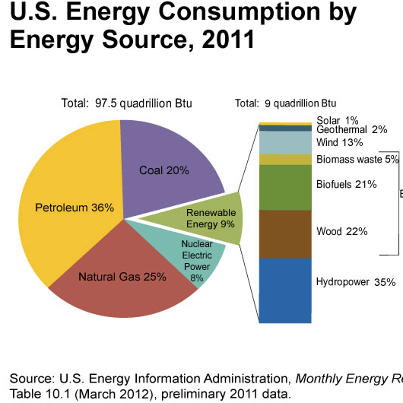
We’ve made it to number one! In January 2013, we’ll officially launch a weekly “People Are Asking” series here on Facebook. But, for now the most asked question of 2012 from our “People Are Asking” series on Twitter was: What is U.S. energy use by type & end-use sector? See the answer below and read more: http://go.usa.gov/Gfe
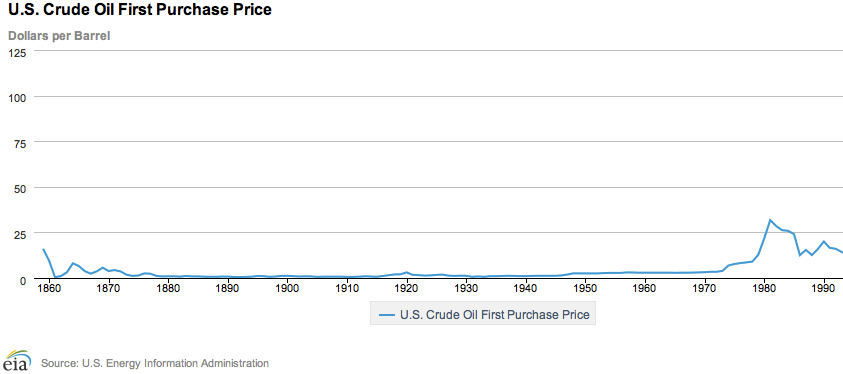
Does EIA have U.S. oil prices back to the 1800s? This question was the second most asked question in 2012 from our “People Are Asking” series on Twitter. The answer is yes. See data at: http://go.usa.gov/rfrR
We’re winding down to our top three questions of 2012 from our “People Are Asking” series on Twitter. Next up: How much CO2 is produced by burning gasoline and diesel fuel? Check out the answer: http://go.usa.gov/m5K
How much U.S. energy is generated from renewables? This was one of the top five questions of 2012 from our “People Are Asking” series on Twitter. We’ve got the answer for you: http://go.usa.gov/Yshz
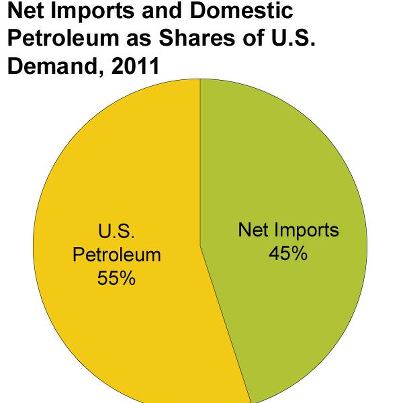
Today starts our countdown of the top five questions of 2012 from our “People Are Asking” series on Twitter. Over the next five days we’ll post these questions along with a link to the answers. First up: How much petroleum does the United States import and from where? http://go.usa.gov/da9
Significant increases in U.S. production of crude oil and other liquid fuels and the outlook for further growth have focused attention on the possibility that the United States could soon surpass Saudi Arabia to become the leading global producer. Read more:
EIA Administrator Adam Sieminski discusses EIA's short-term and long-term outlook for U.S. oil production with Tom Keene and Michael McKee on Bloomberg Television's "Surveillance."
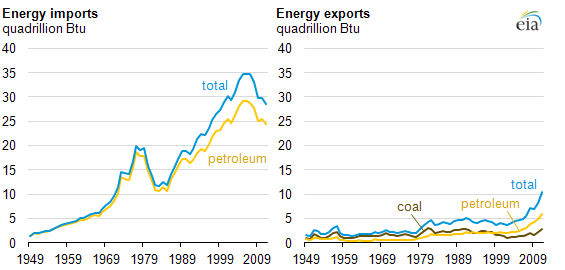
EIA’s Today in Energy has been hosting a series of EIA Energy Perspectives, a graphical overview of energy history in the United States.Today‘s article details the decline in United States energy imports and the increase in energy exports. Check out past and upcoming articles in this series that focus on each component of the U.S. national energy flows as well as their environmental implications. Read more: http://www.eia.gov/todayinenergy/detail.cfm?id=9230 or Read all http://www.eia.gov/todayinenergy/archive.cfm?my=Dec2012