Voluntary Self Disclosures: Help us Help you!

Bookmark and Share

by: Autumn

A Voluntary Self-Disclosure (VSD) is when companies willingly disclose a violation or a suspected violation of the Foreign Trade Regulations (FTR). This disclosure is accompanied by the corrective actions taken in AES, it means you must correct shipment information or file for shipments that were not filed previously.

Submitting a VSD with the U.S. Census Bureau provides you the opportunity to mitigate potential penalties, as well as document discovered errors and corrections. If violations are known, we strongly encourage you to file VSDs to ensure proper due diligence with the FTR. See section 30.74.

Tips When Submitting Voluntary Self-Disclosures

  • Address to: Chief, Foreign Trade Division. Make sure that your letter is on company letterhead, contains a point of contact, a detailed description of when and how the violations occurred, any mitigated circumstance, and the corrective actions taken.
  • Disclosures For Multiple Years. When correcting or filing shipment information into the AES for time periods (up to five years), begin with the most current year (e.g., 2013, 2012, 2011, etc.)
  • Provide Complete Descriptions. You must include a description of the error and correction. Below is an example of a preferred format to submit the corrected information. Detailed account of the type of violation. The detailed account should include an accurate description of the type(s) of violation(s) that occurred. It can be included as an attachment to the letter or may be sent later (via mail or e-mail). Preferably submit in excel format.

In the above image, Schedule B numbers were reported incorrectly for five shipments. The disclosure included the corresponding ITNs, and the original and corrected Schedule B numbers.

Make sure that you have all the information when submitting a disclosure. VSDs that do not have all the pertinent information might not be used for a mitigating factor. Complete procedures for filing VSDs can be found here.

For more information about filing a VSD with the U.S. Census Bureau, please contact the Regulations, Outreach, and Education Branch at 1-800-549-0595, option 3.

Posted in Foreign Trade Regulations | Tagged , , , , , | Leave a comment

Trade Deficit Decreased in 2012

Bookmark and Share

By: Lam & Kevin

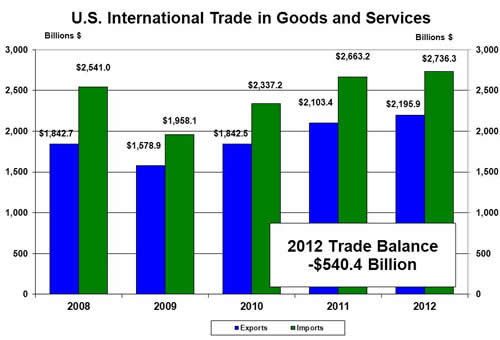
The Nation’s international trade deficit in goods and services decreased to $540.4 billion in 2012 from $559.9 billion in 2011.  Exports increased $92.6 billion to $2,195.9 billion in 2012, with increases of $33.7 billion occurred in capital goods and $12.9 billion in automotive vehicles, parts, and engines. Imports increased $73.0 billion to $2,736.3 billion in 2012, contributed by the increase of $43.1 billion in automotive vehicles, parts, and engines and $37.5 billion in capital goods.

December Goods and Services Deficit Lowest Since January 2010

For December 2012, the trade deficit decreased to $38.5 billion from $48.6 billion in November (revised).  Exports increased $3.9 billion to $186.4 billion, primarily due to the increase of $3.8 billion in industrial supplies and materials. Meanwhile, imports decreased $6.2 billion to $224.9 billion, largely due to the $4.2 billion decrease in industrial supplies and materials and $0.9 billion decrease in automotive vehicles, parts, and engines.

For more information, please visit www.census.gov/ft900.

Automotive Imports Rebound

December’s annual totals for the top 5 countries importing automobiles (NAICS 3361). 2012 was a record high of automotive imports with $167 billion, an increase of 19% from 2011.  Automotive imports have bounced back from the recession of 2009. Within the top 5 countries, Germany had the largest percentage increase of 106% when compared to 2009 and an increase of 20% compared to 2011. Japan, which had the largest decrease of 42% from 2008 to 2009 among the top 5, improved 58% from 2009 to 2012 and improved 26% from 2011 to 2012.

To see more data on this, please visit our Graph of the Month page.

Posted in Foreign Trade Data | Tagged , , , , , , | Leave a comment

Gold Key: The Match.com of Exporting

Bookmark and Share

By: Iris Kapo,  International Trade Specialist  U.S. Commercial Service Philadelphia

Are you interested in exporting to a new market? Need help finding the best overseas business partner?

The U.S. Commercial Service’s Gold Key business matchmaking service does exactly that. The Gold Key Service is a cost-recovery fee based, customized matchmaking service, which enables U.S. companies to find an ideal overseas distributor or business representative. The Gold Key is provided through your local U.S Export Assistance Center which works with the U.S. Embassy in the country of interest.

For larger countries, that require multiple distributors/business partners, the Gold Key Service is offered specifically for the geographic area you would like to target. The service pre-screens and organizes a day or two of meetings with 3-5 potential partners which you then fly out to meet. A Gold Key can take 6-8 weeks to complete so planning ahead is necessary.

Where is the value?

As you can imagine, U.S. companies find this service very valuable because they receive pre-scheduled meetings with pre-qualified distributors vetted by an in-country Commercial Specialist at the U.S. Embassy or Consulate, prior to traveling to the market. Obviously no business partner is absolutely perfect but every effort is made to identify a compatible relationship.

Most companies that come to us for assistance are trying to identify a business partner that will help them gain a foothold in the market, establish their U.S. brand, and pave the way for long term and repeat export sales.

Business is all about creating the right relationships. In international business, this is even more important; those working for you halfway around the world need to be credible and able to meet the high standards you have as a U.S. company.

How does it work?


Gold Key meetings offer a high probability of success because time is taken to identify your ideal business partner and then due diligence is conducted, by our overseas colleagues, to make sure these potentials are reputable and willing to do business with you.

For more information on the Gold Key, pricing, and other business matchmaking services available to you please contact your local U.S. Export Assistance Center.

The U.S. Commercial Service is the trade promotion arm of the U.S. Department of Commerce’s International Trade Administration. Iris Kapo is one of the many trade professionals located in over 100 U.S. cities and in more than 75 countries help U.S. companies get started in exporting or increase sales to new global markets.

Posted in Uncategorized | Tagged , , , , , , , , , , , , , | 1 Comment

The Sandy Effect

Bookmark and Share

by: Jeff

In case you missed it, at the beginning of December Stephen wrote an interesting post on what kind of an effect a hurricane can have on trade. He pointed to some interesting statistics from 2005, which show the impact Hurricane Katrina had on U.S. imports and exports. Looking back at Katrina, we anticipated that our data users would be interested in how much of an effect Hurricane Sandy would have on our October and November trade numbers, so we prepared for your questions.

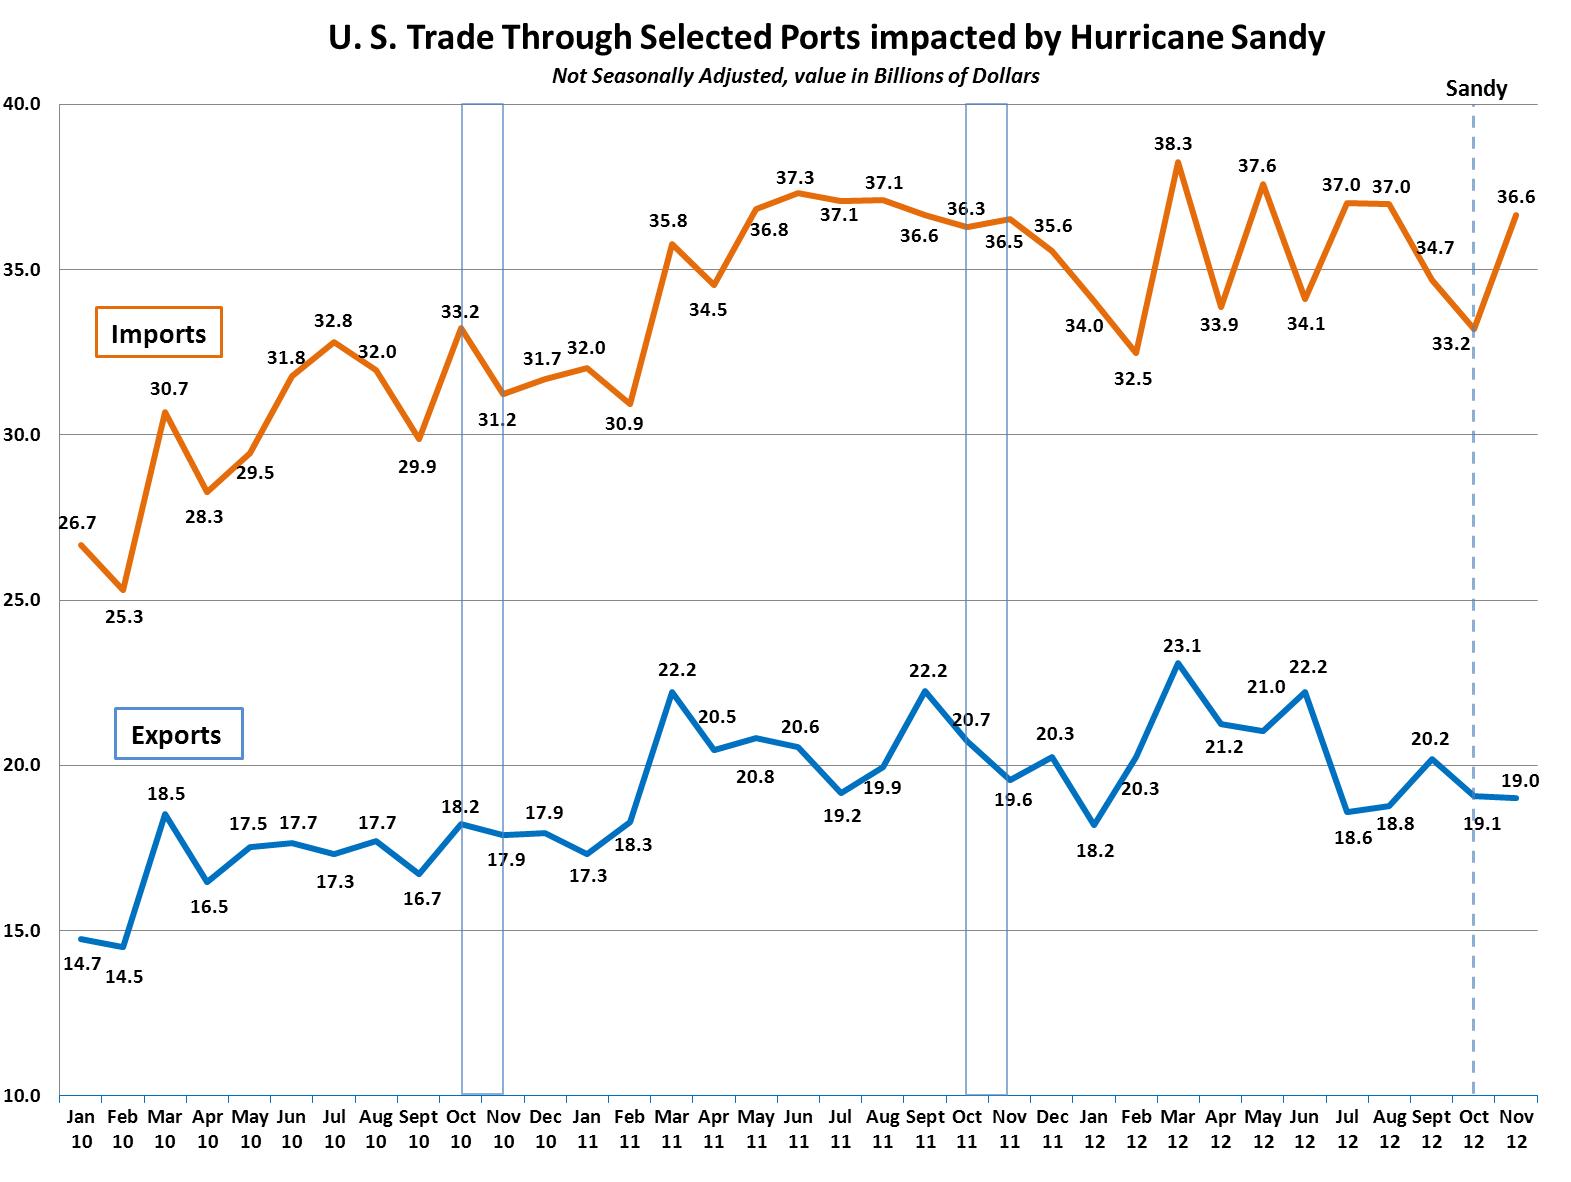
In order to help our data users gauge the impact Sandy had on U.S. trade, we compiled a report on U.S. trade through ports affected by Hurricane Sandy. The report details U.S. trade to and from the eight districts affected by the hurricane (Baltimore, Boston, New York, Norfolk, Portland, Providence, Philadelphia, and Washington D.C.). We released the report with our October and November statistics. If you would like to download the report, Text and Excel files are available on our website. 

Keep in mind that our port totals are not seasonally adjusted. So, if you are looking to compare Sandy totals with totals for all ports, look at the not seasonally adjusted totals in Exhibit 12 of our International Trade in Goods and Services report. That way you are comparing apples to apples. As you can see in the graph above, goods exports from ports affected by Sandy went from $19.1 billion in October to $19.0 billion in November. That is an increase of $0.1 billion for exports from ports affected by Sandy, while total U.S. not seasonally adjusted exports decreased $3.8 billion. Goods imports to ports affected by Sandy went from $33.2 billion in October to $36.6 billion in November. That is an increase of $3.4 billion for imports to ports affected by Sandy, while total U.S. not seasonally adjusted imports decreased $4.4 billion. 

So what kind of impact do you think Sandy had on U.S. trade? Are there any other reports you would like to see on Hurricane Sandy?  

For more export and import port data, visit USATradeOnline and sign up for a one-week (7-day) free trial.

Posted in Foreign Trade Data | Tagged , , , , , , , , , | Leave a comment

Commodity Spotlight: WINE EXPORTS

Bookmark and Share

By: Daniel

Forget tea! Great Britain and Canada are thirsty for U.S. Wine!

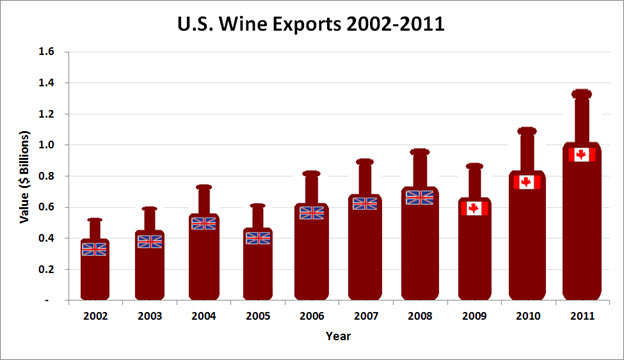
From the rolling hills of Napa Valley to the deep ravines of the Finger Lakes, wineries across the country have been increasing their efforts to expand sales abroad. Over the last decade (2002 through 2011), U.S. wine exports have grown by an astounding $827 million!

 *data from USA Trade Online

Wine exports grew between 2002 and 2004, dropping slightly in 2005 then steadily increasing through 2008 led by demand from Great Britain. However, between 2009 and 2011, wine exports grew sharply due to demand from Canada.

Fundamentals of Exporting Wine

In order for wine producers to take advantage of export opportunities, a few key elements come into play when shipping this fermented goodie:

1. Alcohol Permits:

Alcohol export shipments are regulated through the Alcohol and Tobacco Tax and Trade Bureau (TTB) of the U.S. Department of Treasury. According to the TTB, requirements for exporting alcoholic beverages depend on “what product is being exported, whether the exporter is also the producer of the product, and/or whether the product is being exported taxpaid or without payment of tax.” However, exporters should keep in mind that most alcoholic beverages require a permit to export.

2. Wine Classification

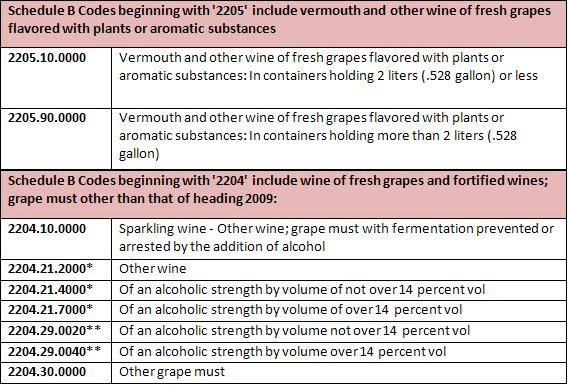
Exporters will need to use a Schedule B code to classify their commodity. Currently wine exports are classified using the following Schedule B codes:

        *Effervescent wine in containers holding 2 liters (.528 gallon) or less
         **Other

For more information on exporting alcoholic beverages, please contact TTB’s International Trade Division at (202) 453-2260 or send and e-mail to itd@ttb.gov. For additional guidance on how the Foreign Trade Regulations apply, please contact the Regulations, Outreach and Education Branch (ROEB) at 1-800-549-0595, option 3.

Posted in Foreign Trade Data | Tagged , , , , , , , , | 4 Comments

Trade Grows in November

Bookmark and Share

By: Sean

Overall, the deficit of goods and services increased to $48.7 billion in November from $42.1 billion in October (revised). Exports increased to $182.6 billion in November from $180.8 billion in October (revised). Exports saw the largest increases in both capital goods ($0.9 billion) and automotive vehicles, parts, and engines ($0.7 billion). Meanwhile, imports increased to $231.3 billion in November from $222.9 billion in October (revised). This $8.4 billion increase was due largely to the increased importation of consumer goods ($4.6 billion), automotive vehicles, parts, and engines ($1.5 billion), and industrial supplies and materials ($1.3 billion). For more in depth analysis, please go to www.census.gov/ft900

Consumers Consuming

Imports of consumer goods hit a record high of $45.3 million in November. This was an increase of $4.6 million or 11.2%. This record high made me wonder how imports of other principal end-use categories were faring so I did a little research and put together the following graph.


As you can see, there was a significant drop across the spectrum starting in September 2008. Since that time, most of the commodity groupings have slowly risen and even passed their pre-recession levels. Even industrial supplies, which have not fully rebounded, have increased 84.8% from their low of $33.2 billion in May 2009. It will certainly be interesting to see if these trends continue in the future.

If you share my interest, please go to our website at www.census.gov/foreign-trade/statistics/historical. Here you can find monthly data from 1992-present for Goods by Principal End-Use Category.

Posted in Foreign Trade Data | Tagged , , , | 1 Comment

Happy New Year!

Bookmark and Share

by: Stephen

On behalf of the Global Reach Blog Managers and the Foreign Trade Division (FTD) of the United States Census Bureau, we would like to say Happy New Year!

We hope that you have enjoyed your holiday season and look forward to working with you in 2013. This year there are some changes that will be coming to the export process and we encourage you to continue to use this Blog as an information source to keep updated on the changes being made. We would like to take this opportunity to remind you about a few key products to keep aware of throughout 2013.

USATradeOnline – Access current and cumulative U.S. export and import data for over 9,000 export commodities and 17,000 import commodities. USATradeOnline provides trade statistics using the Harmonized System (HS) up to the 10-digit level and the North American Industry Classification System (NAICS) commodity classification codes up to the 6-digit level. Go to USATradeOnline and claim your one week free trial now.

AESDirect – This FREE online program allows exporters or their authorized agents to file their Electronic Export Information in a timely and efficient manner to the Automated Export System.

Subscribe to Mailing Lists – The Foreign Trade Division offers multiple mailing lists ranging from Trade Data, AES Updates and Other Partnership Agency request for broadcasts. These mailing subscriptions provide you with the timeliest information from the FTD and act as the means of communication with the Export Community.

We hope that you continue to take advantage of the great resources made available to you from our Foreign Trade Division. As a reminder for your Electronic Export Information, please remember to report the Estimated Date of Export in the Automated Export System with the correct year, for current shipments in the AES please report the year 2013.

Posted in Export Filing, Foreign Trade Data | Tagged , , , , , , , , , , | 1 Comment

United States Postal Service Exemption Codes

Bookmark and Share

By Thomas

Do you have a holiday package you need to ship out of the country?

We have received many calls from customers using the United States Postal Service (USPS) website.

When you visit the USPS.com, it gives several options to choose from when supplying package information to the site for proper mailing (‘Enter Customs Information’). Let us clarify a couple of key elements:

Proof of Filing Citation (PFC): notification confirming that you filed to the Automated Export System. This is also known as the Internal Transaction Number or ITN.
AES Exemption : If you are not required to file, this note indicates why you are exempt from filing.

Choosing the Appropriate Exemption

On USPS.com, the two main options to choose from are: 30.36 and 30.37(a). Take a look at what they mean:

  • 30.36: Use for shipments destined to Canada that do not require a license, regardless of value.
  • 30.37(a): Use for shipments under $2,500 destined to countries other than Canada that do not require a license.

For more information about these exemptions and/or other regulation questions, please use the following link:

Full list of exemptions and/or other regulation questions

If you are still unsure, give us a call at 800-549-0595, option 3 to speak with a specialist.

Posted in Export Filing, Foreign Trade Regulations | Tagged , , , , , , , , | 2 Comments

Deficit Balance Increased as Exports and Imports Decreased in October 2012

Bookmark and Share

By: Lam

Overall, the deficit of goods and services is up $1.9 billion from $40.3 billion in September (revised) to $42.2 billion in October. Specifically, exports decreased $6.8 billion from $187.3 billion in September (revised) to $180.5 billion in October. Imports went from $227.6 billion in September (revised) to $222.8 billion in October resulting in a $4.9 billion decrease.

Major contributors to the decrease of goods exports include industrial supplies and materials ($2.9 billion), capital goods ($1.9 billion) and foods, feeds, and beverages ($1.4 billion). For goods imports, the major contributors to the decrease in October were consumer goods ($3.6 billion). We also saw a slight increase for other goods ($0.2 billion) for exports and industrial supplies and materials ($0.4 billion) for imports. 

For more detail, click here.

Economic Impact of Mississippi River Drought

The worst drought since 1956 hit the nation this year adversely affecting the Mississippi River’s water level and goods shipments. Even with the precipitation from hurricane Isaac, the water level on the Mississippi is still decreasing. According to the New York Times, the reduction of the water flow from Missouri (an annual occurrence that started on November 11, 2012), coupled with the drought, will not help with the dropping water level on the river. Cargo ships will either temporarily cease transporting goods down the river or reduce the load in which they can carry to compensate for the low water level.

Source: National Oceanic and Atmospheric Administration

Ceasing transporting goods or reducing the number of goods transported on the Mississippi River could potentially affect the $50.5 billion (vessel value) exports out of the New Orleans district in 2012 through October alone. Out of the $50.5 billion (vessel value) exports in 2012, some of the major exports include petroleum, soybeans, corn, coal, light oils, and wheat.  Within the New Orleans district, top performing ports such Gramercy, New Orleans, and Morgan City in Louisiana could be affected by the low water level. A full list of ports within New Orleans and other district, import and export data, and more are available on USA Trade Online.

Posted in Foreign Trade Data | Tagged , , , , | 1 Comment

Nature Strikes Again. What Does That Mean for Trade?

Bookmark and Share

By: Stephen

It is incredible to see the impact that a single storm can make on an area. What might be just as impressive is the immediate effect it can have on Trade. It will inevitably take some time before we know the cost on exports and imports from Hurricane Sandy in the affected regions however, statistics give us some insight as to what we could see. By looking into the impact the trade community saw after Hurricane Katrina hit the Southeast in late August of 2005, we can see what history says about how a storm can have an immediate effect on trade.

Using USA Trade Online, we are able to look into exports and imports down to the Port Level data. This data can be a very useful to exporters when determining the impact a storm or other large events can have on an identified area. In this case, I decided to look at Port data for New Orleans, LA (District) before and after Katrina hit. I captured data for the months of July, August, September and October on export and imports.

Both exports and imports saw the immediate impact that Katrina had on the coast of Louisiana. Exports went from $2.51 billion reported in August, to $2.02 billion reported in September. A change of just under $500 million, seen mostly from the loss of $575 million in vessel shipments alone. These trends were followed closely by the import numbers that showed a change from $7.42 billion reported in August, to $6.86 billion in September. This decrease of $564 million was seen mostly from a $556 million loss in import shipments using vessel as their mode of transportation.

Exports and imports saw a significant increase in the month of October, with exports up to $2.64 billion and imports up to $8.82 billion. This dramatic increase of $1.96 billion in October for imports came almost entirely from vessel shipments.

It will be interesting to see the impact that Sandy has on the Northeast and how that directly impacts the trade for that region. What we have learned from Katrina is there will be an immediate impact on exports and imports. Continue to keep an eye on the Trade Numbers for the affected ports by registering for a free trial to USATradeOnline today.

Also, check out the Director’s Blog ‘ What the Census Bureau Can Tell You About Some of the Communities Affected by Hurricane Sandy’ that discusses some other statistics that the Census Bureau looks at in regards to Hurricane Sandy.

Posted in Foreign Trade Data | Tagged , , , , , , , , , | 1 Comment