Situation Update: Summary of Weekly FluView
Key Flu Indicators
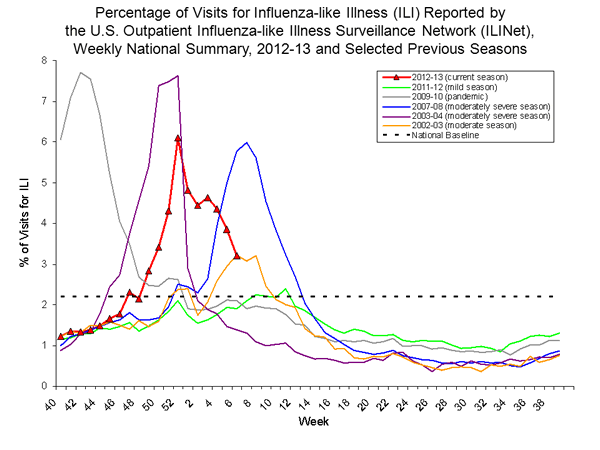
According to the latest FluView report, while influenza activity remains elevated across most of the country, there is an overall downward trend in activity. It's likely that influenza-like-illness (ILI) has peaked in the United States at this time, though activity may continue for some time, with additional hospitalizations and deaths being reported. Below is a summary of the key indicators for the week of February 3-9, 2013:
- For the week of February 3-9, the proportion of people seeing their health care provider for influenza-like illness (ILI) continued to decrease for the third consecutive week. Most regions are showing stable or declining levels of ILI activity again this week.
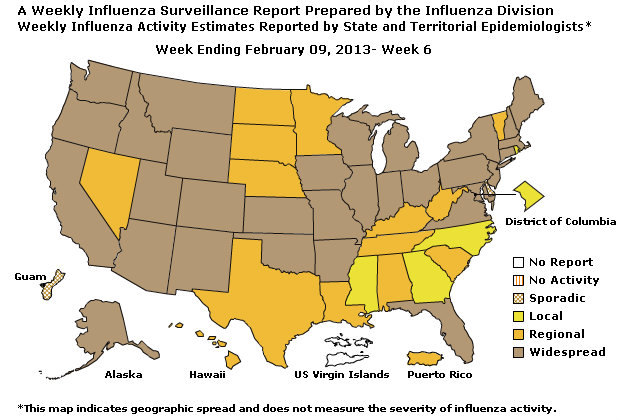
- Eleven states and New York City reported high ILI activity. Last week CDC reported 19 states and New York City with high ILI activity. Additionally, 10 states reported moderate levels of ILI activity. States reporting high ILI activity for the week of February 3-9 include Alabama, California, Idaho, Kansas, Michigan, Missouri, Nevada, New Jersey, Texas, Utah, and Vermont. ILI activity data indicate the amount of flu-like illness that is occurring in each state.
- Thirty-one states reported widespread geographic influenza activity for the week of February 3-9, 2013; a decrease from 38 states in the previous week. Geographic spread data show how many areas within a state or territory are seeing flu activity.
- Since October 1, 2012, 8,953 laboratory-confirmed influenza-associated hospitalizations have been reported; an increase of 1,069 hospitalizations from the previous week. This translates to a rate of 32.1 influenza-associated hospitalizations per 100,000 people in the United States. Overall, hospitalization rates seem to be leveling off again this week, but remain high among people 65 and older, who account for more than half of all reported hospitalizations.
- Hospitalization data are collected from 15 states and represent approximately 9% of the total U.S. population. The number of hospitalizations reported does not reflect the actual total number of influenza-associated hospitalizations in the United States.
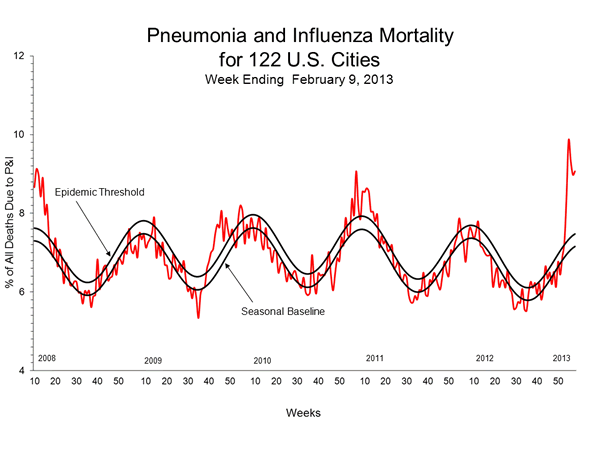
- The proportion of deaths attributed to pneumonia and influenza (P&I) based on the 122 Cities Mortality Reporting System increased slightly this week, and remains above the epidemic threshold.
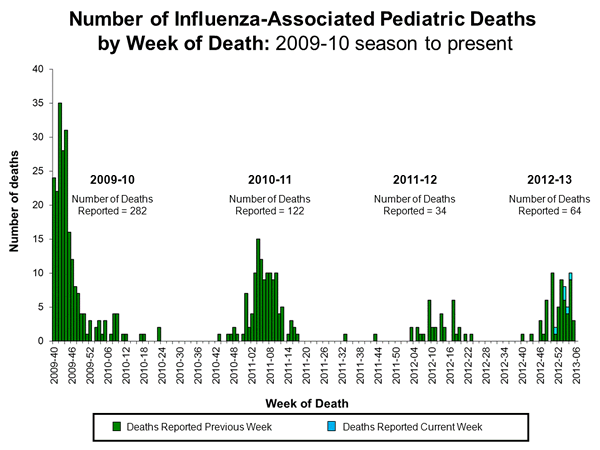
- Five influenza-related pediatric deaths were reported during the week of February 3-9, 2013. One of the deaths was associated with an influenza A virus for which the subtype was not determined. Four of the deaths were associated with influenza B viruses. This brings the total number of influenza-associated pediatric deaths reported to CDC for 2012-2013 to 64. Additional information regarding pediatric deaths is available through FluView Interactive.
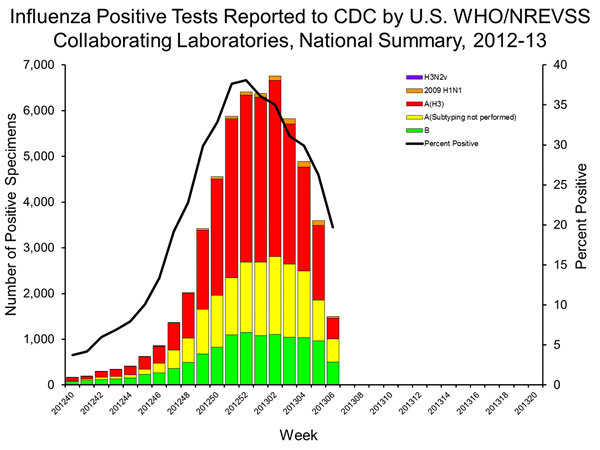
- Nationally, the percentage of respiratory specimens testing positive for influenza in the United States during the week of February 3-9, 2013 continued to decrease.
- Influenza A (H3N2), 2009 influenza A (H1N1), and influenza B viruses have all been identified in the U.S. this season. During the week of February 3-9, 993 of the 1,499 influenza-positive tests reported to CDC were influenza A and 506 were influenza B viruses. Of the 488 influenza A viruses that were subtyped, 92% were H3 viruses and 8% were 2009 H1N1 viruses.
- Since October 1, 2012, CDC has antigenically characterized 1,088 influenza viruses, including 86 2009 influenza A (H1N1) viruses, 677 influenza A (H3N2) viruses and 325 influenza B viruses.
- All 86 of the 2009 influenza A (H1N1) viruses were characterized as A/California/7/2009-like. This is the influenza A (H1N1) component of the Northern Hemisphere vaccine for the 2012-2013 season.
- Of the 677 influenza A (H3N2) viruses, 673 (99.7%) were characterized as A/Victoria/361/2011-like. This is the influenza A (H3N2) component of the Northern Hemisphere influenza vaccine for the 2012-2013 season.
- Of the 325 influenza B viruses characterized, 70.8% belonged to the B/Yamagata lineage of viruses, and were characterized as B/Wisconsin/1/2010-like, the influenza B component for the 2012-2013 Northern Hemisphere influenza vaccine. The remaining 29.2% of the tested influenza B viruses belonged to the B/Victoria lineage of viruses.
- Since October 1, 2012, CDC has tested 184 2009 influenza A (H1N1), 1,072 influenza A (H3N2), and 396 influenza B virus samples for resistance to neuraminidase inhibitors this season. While the majority of the tested virus samples showed susceptibility to the antiviral drugs oseltamivir and zanamivir, two 2009 H1N1 viruses (reported during week 3 and week 6) showed a mutation indicative of resistance to oseltamivir. High levels of resistance to the adamantanes (amantadine and rimantadine) persist among 2009 influenza A (H1N1) and A (H3N2) viruses. Adamantanes are not effective against influenza B viruses.
FluView is available – and past issues are archived – on the CDC website.
Note: Delays in reporting may mean that data changes over time. The most up to date data for all weeks during the 2012-2013 season can be found on the current FluView.
Contact Us:
- Centers for Disease Control and Prevention
1600 Clifton Rd
Atlanta, GA 30333 - 800-CDC-INFO
(800-232-4636)
TTY: (888) 232-6348 - Contacte CDC-INFO
Descargo de responsabilidad: Es posible que en este sitio encuentre algunos enlaces que le lleven a contenido disponible sólo en inglés. Además, el contenido que se ha traducido del inglés se actualiza a menudo, lo cual puede causar la aparición temporal de algunas partes en ese idioma hasta que se termine de traducir (generalmente en 24 horas). Llame al 1-800-CDC-INFO si tiene preguntas sobre la influenza de temporada, cuyas respuestas no ha encontrado en este sitio. Agradecemos su paciencia.
