| Bleaching Alert Area | Provides near-real-time information on thermal stress that induces coral bleaching for 24 selected reef sites around the globe. The information is extracted from near-real-time satellite remotely sensed global sea surface temperature (SST) measurements and derived indices of coral bleaching related thermal stress. Each reef site includes links to SST, SST Anomalies, Coral Bleaching HotSpots, Degree Heating Weeks, Time Series, SST Contour Charts, Ocean Surface Winds, and On-site Buoys as available for that reef. Product Link |
|
|
||
| POES | Resolution: 50 Km | Frequency: Twice Weekly |
| Coral Bleaching Virtual Stations |
Bleaching Alert Area product identifies, for the twice-weekly time period ending on the day indicated in the product, locations where thermal stress reaches various levels that can lead to coral bleaching. A scale of five coral bleaching thermal stress levels, including No Stress, Bleaching Watch, Bleaching Warning, and Bleaching Alert Levels 1 and 2, is used. The thermal stress classification is described in detail at: http://coralreefwatch.noaa.gov/satellite/baa/index.html. Both the Bleaching Alert Area, as well as the level of stress defined by the product, are derived from Coral Bleaching HotSpots and Degree Heating Weeks (DHW) values measured at each site for any given twice-weekly time period. Product Link |
|
|
||
| POES | Resolution: 50 Km | Frequency: Twice Weekly |
| Degree Heating Week Charts | Degree Heating Weeks (DHWs) indicate the accumulation of thermal stress that coral reefs have experienced over the past 12 weeks. One DHW is equivalent to one week of sea surface temperatures one degree Celsius greater than the expected summertime maximum. Two DHWs are equivalent to two weeks at one degree above the expected summertime maximum OR one week of two degrees above the expected summertime maximum. Also called Coral Reef Degree Heating Weeks. Product Link |
|
|
||
| POES | Resolution: 50 Km | Frequency: Twice Weekly |
| HotSpots | Coral Bleaching HotSpots are areas that have exceeded the maximum monthly mean SST by at least one degree Celsius. Product Link |
|
|
||
| POES | Resolution: 50 Km | Frequency: Twice Weekly |
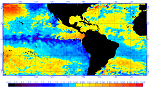
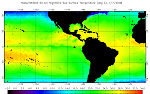
| SST Anomaly Charts | The SST anomaly field (degrees C) is the difference between the 50 km nighttime-only SST and the nighttime-only monthly mean SST climatology. The climatology is based on nighttime observations from 1984-1993, with SST observations from the years 1991 and 1992 omitted due to aerosol contamination from the eruption Mt. Pinatubo in June of 1991. Product Link |
|
|
||
| POES | Resolution: 50 Km | Frequency: Twice Weekly |
| SST Nighttime Field Image Charts | The operational night-only SST analysis is at a resolution of 50 km and is used to produce the SST anomaly charts. Product Link |
|
|
||
| POES | Resolution: 50 Km | Frequency: Twice Weekly |