News Release Information
12-1556-SAN
Tuesday, July 31, 2012
Contacts
- Technical Information: (415) 625-2284
- Media Contact: (415) 625-2270, option 1
- BLSInfoSF@bls.gov
- www.bls.gov/ro9
Alternative Measures of Labor Underutilization, Oregon – 2011
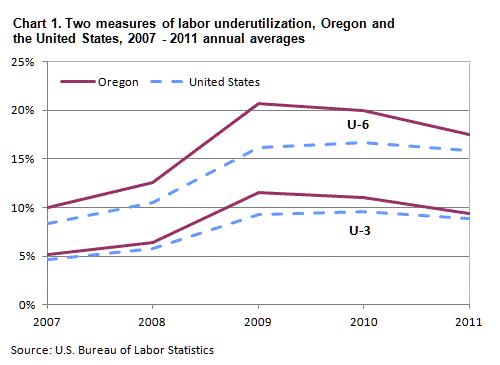
In 2011, the broadest measure of labor underutilization, designated U-6 (which includes the unemployed, workers employed part-time for economic reasons, and the marginally attached to the labor force), was 17.5 percent in Oregon, down from 20.0 percent in 2010, the U.S. Bureau of Labor Statistics reported today. (See table 1.) Regional Commissioner Richard J. Holden pointed out that despite this decrease, the rate was 7.5 percentage points above its level in 2007 when the national recession began. (See chart 1) Nationally, the U-6 rate averaged 15.9 percent in 2011.
The official concept of unemployment (U-3 in the U-1 to U-6 range of measures) includes all jobless persons who are available to take a job and have actively sought work in the past four weeks. (The official measure of unemployment in states is derived using a statistical model that incorporates data from the Current Population Survey [CPS] and other sources, and this model-based estimate can differ from the direct CPS estimate.) In Oregon 9.4 percent of the labor force was unemployed, as measured by the CPS, in 2011. By comparison, 8.9 percent were jobless nationwide.
Oregon had 187,400 unemployed residents in 2011 according to the CPS, and another 133,400 were employed part time for economic reasons (also known as involuntary part time). These individuals were working part time because of slack work or business conditions or because they were unable to find a full-time job. (See chart 2.) Nationwide, there were 8.6 million individuals working part time for economic reasons in 2011.
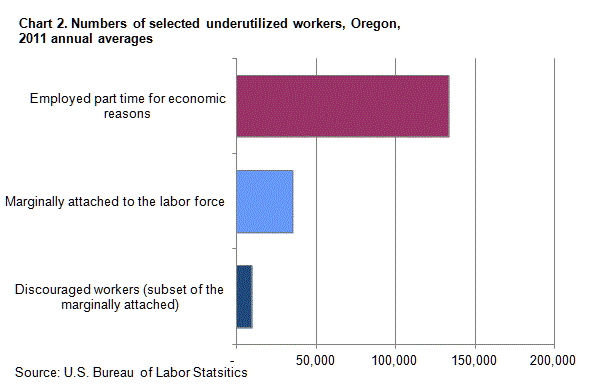
In 2011, the number of individuals considered to be marginally attached to the labor force in Oregon reached 35,400. People marginally attached to the labor force are not working, but indicate that they would like to work, are available to work, and have looked for work at some time during the past 12 months, even though they had not searched for work in the 4 weeks preceding the survey for reasons such as school attendance or family responsibilities. In the United States, the number marginally attached totaled 2.6 million in 2011.
Discouraged workers, included among the marginally attached, are persons who are not currently looking for work because they believe no jobs are available for them. In 2011, there were 9,200 in Oregon. Discouraged workers accounted for slightly just over one quarter of the marginally attached in the state. The U-4 measure, which adds discouraged workers to the number of the unemployed (expressed as percentage of the labor force plus the number of discouraged workers), was 9.8 percent in Oregon in 2011 compared with 9.5 percent nationwide.
From 2010 to 2011, the rates of labor underutilization trended down in Oregon and the United States. The percentage declines for all six measures in Oregon were larger than the national decreases. For example, the annual average for U-6 was down 2.5 points in Oregon and 0.8 point nationwide.
State comparisons
Nevada registered the highest rates for all six measures of labor underutilization among the 50 states in 2011, ranging from a U-2 of 8.5 percent to a U-6 of 22.7 percent. (See table 2.) Other states with high U-6 rates included California (21.1 percent), Michigan (18.8 percent), and Rhode Island (18.6 percent). Nevada, California, and Rhode Island also had the highest CPS-based unemployment rates, averaging 13.1, 11.6, and 11.1 percent, respectively. States with high CPS-based unemployment rates tended to have high values for the other five measures.
Similarly, states with low U-3 rates usually recorded low values for the other measures. North Dakota had the lowest rates for all six measures, including a U-6 of 6.6 percent, a U-3 of 3.6 percent, and a U-1 of 1.2 percent. Only two other states, Nebraska and South Dakota, registered U-6 rates below 10.0 percent, at 8.9 and 9.3 percent, respectively.
In 2011, 38 states had all six measures of underutilization decrease over the year, including Oregon. Three states had U-6 rates that decreased by at least 2.0 percentage points from 2010 to 2011: Oregon (-2.5 points), and Michigan and Ohio (each -2.2 points). Among the states with the highest U-6 rates in 2011 (Nevada, Michigan, California and Rhode Island), the U-6 rate in each state declined from the previous year.
The U-6 rates rose in six states and the District of Columbia from 2010 to 2011, with the District having the largest increase, up 1.8 percentage points to 15.8 percent.
Technical note
The U.S. Bureau of Labor Statistics (BLS) produces six measures of labor underutilization based on Current Population Survey (CPS) data. Monthly, the BLS publishes these six measures for the United States as a whole in the Employment Situation news release. (See www.bls.gov/news.release/empsit.t15.htm.) State estimates, presented as 4-quarter averages, are provided each quarter on the BLS website (www.bls.gov/lau/stalt.htm).
The civilian labor force is the sum of employed and unemployed persons. Those not classified as employed or unemployed are not in the labor force. The unemployment rate is the number unemployed as a percent of the labor force.
People are classified as employed if they did any work at all as paid employees during the reference week; worked in their own business, profession, or on their own farm; or worked without pay at least 15 hours in a family business or farm. People are also counted as employed if they were temporarily absent from their jobs because of illness, bad weather, vacation, labor-management disputes, or personal reasons.
People are classified as unemployed if they meet all of the following criteria: they had no employment during the reference week; they were available for work at that time; and they made specific efforts to find employment sometime during the 4-week period ending with the reference week. Persons laid off from a job and expecting recall need not be looking for work to be counted as unemployed. The unemployment data derived from the household survey in no way depend upon the eligibility for or receipt of unemployment insurance benefits. The official concept of unemployment (as measured in the CPS) is equivalent to the U-3 in the U-1 to U-6 range of measures. The other measures are provided to data users and analysts who want more narrowly (U-1 and U-2) or broadly (U-4 through U-6) defined measures. BLS updates these measures for each state on a 4-quarter moving-average basis.
The measures for states are analyzed on a 4-quarter average basis in order to increase the reliability of the CPS estimates, which are based on relatively small sample sizes at the state level, and to eliminate seasonality. Due to the inclusion of lagged quarters, the state measures may not fully reflect the current status of the labor market. For additional information on state estimates derived directly from the CPS, see www.bls.gov/gps/notescps.htm.
Data are calculated from quarterly tables in which the components of each measure are rounded to the nearest hundred. As a result, these measures contain slightly more rounding error than that found in typical CPS annual average tabulations (in which rates are calculated based on unrounded data). Due to small state sample sizes, neither monthly nor quarterly state data from the CPS satisfy BLS publication standards.
Note that the unemployment rates (U-3) in this release are derived directly from the CPS, because this is the only source of data for the various components of the alternative measures. As a result, these U-3 measures may differ from the official state unemployment rates for the same period. The latter are estimates developed from statistical models that greatly improve the reliability of the top-side labor force and unemployment estimates. Those models, developed by the Local Area Unemployment Statistics (LAUS) program, incorporate CPS estimates, as well as input data from other sources. The model-based estimates are accessible through the LAUS home page at www.bls.gov/lau/home.htm.
The level (that is, number of persons) estimates reflect independent population estimates for each year. Because these population controls are not revised, level estimates between years are not fully comparable. However, the application of new population controls generally does not affect ratios or proportions, such as U-1 through U-6.
Information in this release will be made available to sensory impaired individuals upon request. Voice phone: 202-691-5200; TDD message referral phone number: 1-800-877-8339.
| Measure | Oregon | United States | ||||
|---|---|---|---|---|---|---|
| 2009 | 2010 | 2011 | 2009 | 2010 | 2011 | |
U-1 Persons unemployed 15 weeks or longer, as a percent of the civilian labor force |
5.4 | 6.7 | 5.3 | 4.7 | 5.7 | 5.3 |
U-2 Job losers and persons who completed temporary jobs, as a percent of the civilian labor force |
7.9 | 7.8 | 5.8 | 5.9 | 6.0 | 5.3 |
U-3 Total unemployed, as a percent of the civilian labor force (official concept of unemployment(1)) |
11.5 | 11.0 | 9.4 | 9.3 | 9.6 | 8.9 |
U-4 Total unemployed plus discouraged workers, as a percent of the civilian labor force plus discouraged workers(2) |
11.8 | 11.6 | 9.8 | 9.7 | 10.3 | 9.5 |
U-5 Total unemployed, plus discouraged workers, plus all other persons marginally attached to the labor force, as a percent of the civilian labor force plus all persons marginally attached to the labor force(2) |
12.7 | 12.5 | 10.9 | 10.5 | 11.1 | 10.4 |
U-6 Total unemployed, plus all persons marginally attached to the labor force, plus total employed part time for economic reasons, as a percent of the civilian labor force plus all persons marginally attached to the labor force(2) |
20.7 | 20.0 | 17.5 | 16.2 | 16.7 | 15.9 |
Footnotes:(1) The U-3 rates presented are unofficial state estimates derived from the Current Population Survey (CPS). The official measure is a model-based estimate available through the Local Area Unemployment Statistics (LAUS) program at http://www.bls.gov/lau/data.htm. (2) Persons marginally attached to the labor force are those who currently are neither working nor looking for work but indicate that they want and are available for a job and have looked for work sometime in the past 12 months. Discouraged workers, a subset of the marginally attached, have given a job-market related reason for not currently looking for work. Persons employed part time for economic reasons are those who want and are available for full-time work but have had to settle for a part-time schedule. |
||||||
| State | Measure | |||||
|---|---|---|---|---|---|---|
| U-1 | U-2 | U-3 | U-4 | U-5 | U-6 | |
United States |
5.3 | 5.3 | 8.9 | 9.5 | 10.4 | 15.9 |
Alabama |
6.1 | 5.4 | 9.8 | 10.6 | 11.6 | 16.2 |
Alaska |
2.8 | 4.2 | 7.6 | 8.1 | 9.1 | 13.5 |
Arizona |
5.9 | 5.2 | 9.5 | 10.1 | 11.2 | 18.0 |
Arkansas |
4.4 | 4.8 | 8.6 | 9.2 | 9.9 | 14.1 |
California |
7.0 | 7.0 | 11.6 | 12.3 | 13.4 | 21.1 |
Colorado |
4.7 | 5.2 | 8.4 | 8.7 | 9.5 | 15.1 |
Connecticut |
5.6 | 5.7 | 8.9 | 9.6 | 10.4 | 15.4 |
Delaware |
4.4 | 4.6 | 7.5 | 8.1 | 8.8 | 13.2 |
District of Columbia |
6.7 | 5.0 | 10.4 | 11.1 | 12.4 | 15.8 |
Florida |
6.7 | 6.2 | 10.0 | 10.8 | 11.6 | 17.6 |
Georgia |
6.3 | 5.8 | 10.1 | 10.8 | 11.8 | 17.1 |
Hawaii |
4.5 | 4.2 | 7.3 | 7.8 | 9.0 | 15.1 |
Idaho |
4.4 | 4.9 | 8.7 | 9.1 | 9.9 | 16.1 |
Illinois |
6.1 | 6.2 | 9.7 | 10.2 | 10.9 | 17.0 |
Indiana |
5.7 | 5.2 | 9.0 | 9.6 | 10.3 | 15.7 |
Iowa |
2.6 | 3.2 | 5.8 | 6.1 | 6.7 | 11.3 |
Kansas |
3.5 | 3.9 | 6.7 | 7.0 | 7.8 | 12.1 |
Kentucky |
5.1 | 5.7 | 9.5 | 10.0 | 10.7 | 15.6 |
Louisiana |
4.0 | 3.5 | 7.8 | 8.4 | 9.5 | 13.4 |
Maine |
4.1 | 4.6 | 8.0 | 8.5 | 9.5 | 15.1 |
Maryland |
4.0 | 4.2 | 7.0 | 7.7 | 8.6 | 12.6 |
Massachusetts |
4.3 | 4.8 | 7.3 | 7.8 | 8.7 | 14.3 |
Michigan |
6.1 | 6.0 | 10.2 | 11.1 | 12.3 | 18.8 |
Minnesota |
3.3 | 3.6 | 6.5 | 6.8 | 7.6 | 12.8 |
Mississippi |
6.3 | 5.9 | 10.5 | 11.1 | 12.0 | 16.4 |
Missouri |
4.9 | 4.6 | 8.4 | 8.8 | 9.5 | 14.4 |
Montana |
3.1 | 4.6 | 7.3 | 7.7 | 8.6 | 15.3 |
Nebraska |
2.0 | 2.3 | 4.5 | 4.7 | 5.2 | 8.9 |
Nevada |
8.7 | 8.5 | 13.1 | 14.0 | 15.5 | 22.7 |
New Hampshire |
2.6 | 3.2 | 5.4 | 5.8 | 6.5 | 11.3 |
New Jersey |
6.2 | 6.4 | 9.4 | 10.1 | 11.0 | 16.0 |
New Mexico |
4.3 | 3.6 | 7.4 | 7.9 | 9.6 | 14.7 |
New York |
5.0 | 4.9 | 8.1 | 9.0 | 9.9 | 14.3 |
North Carolina |
6.5 | 6.4 | 10.5 | 11.1 | 11.8 | 17.9 |
North Dakota |
1.2 | 1.5 | 3.6 | 3.7 | 4.2 | 6.6 |
Ohio |
5.1 | 5.1 | 8.7 | 9.0 | 9.8 | 14.7 |
Oklahoma |
2.8 | 2.9 | 6.2 | 6.8 | 7.8 | 10.7 |
Oregon |
5.3 | 5.8 | 9.4 | 9.8 | 10.9 | 17.5 |
Pennsylvania |
4.2 | 4.8 | 7.8 | 8.2 | 9.4 | 13.9 |
Rhode Island |
7.0 | 6.9 | 11.1 | 11.7 | 12.7 | 18.6 |
South Carolina |
6.6 | 6.4 | 10.5 | 11.4 | 12.4 | 18.2 |
South Dakota |
1.8 | 2.1 | 4.9 | 5.4 | 6.1 | 9.3 |
Tennessee |
5.1 | 5.2 | 9.2 | 9.6 | 10.5 | 15.5 |
Texas |
3.9 | 4.1 | 7.8 | 8.3 | 9.1 | 14.0 |
Utah |
3.2 | 4.0 | 7.0 | 7.3 | 8.1 | 13.3 |
Vermont |
2.5 | 3.6 | 5.8 | 6.1 | 6.8 | 11.6 |
Virginia |
3.9 | 3.6 | 6.5 | 6.9 | 7.6 | 11.8 |
Washington |
5.1 | 5.4 | 9.4 | 9.9 | 11.2 | 17.8 |
West Virginia |
4.6 | 4.1 | 8.1 | 8.6 | 9.3 | 13.7 |
Wisconsin |
4.2 | 4.3 | 7.8 | 8.2 | 9.0 | 14.2 |
Wyoming |
2.4 | 2.9 | 5.9 | 6.2 | 6.7 | 10.6 |
| Substate areas | ||||||
Los Angeles County |
7.6 | 7.2 | 12.2 | 12.8 | 13.8 | 22.8 |
New York City |
5.8 | 5.7 | 9.0 | 10.0 | 11.1 | 15.4 |
Notes
See table 1 for definitions of measures and related footnote information.
Last Modified Date: July 31, 2011