Acquiring Work Experience with Age

Bookmark and Share

Written by: Rebecca Chenevert and Daniel Litwok

In the workplace, we expect age to be an important factor in how much people are paid—as we get older, we gain experience and our value to employers increases. However, that expectation may not hold for those who leave the workforce for an extended period of time, for reasons including raising children or getting additional education.

We can study the link between age and experience through the Census Bureau’s Survey of Income and Program Participation (SIPP), which asks people detailed questions about their current and past employment. The answers respondents provide make it possible to see how age, education, experience and earnings relate to each other.

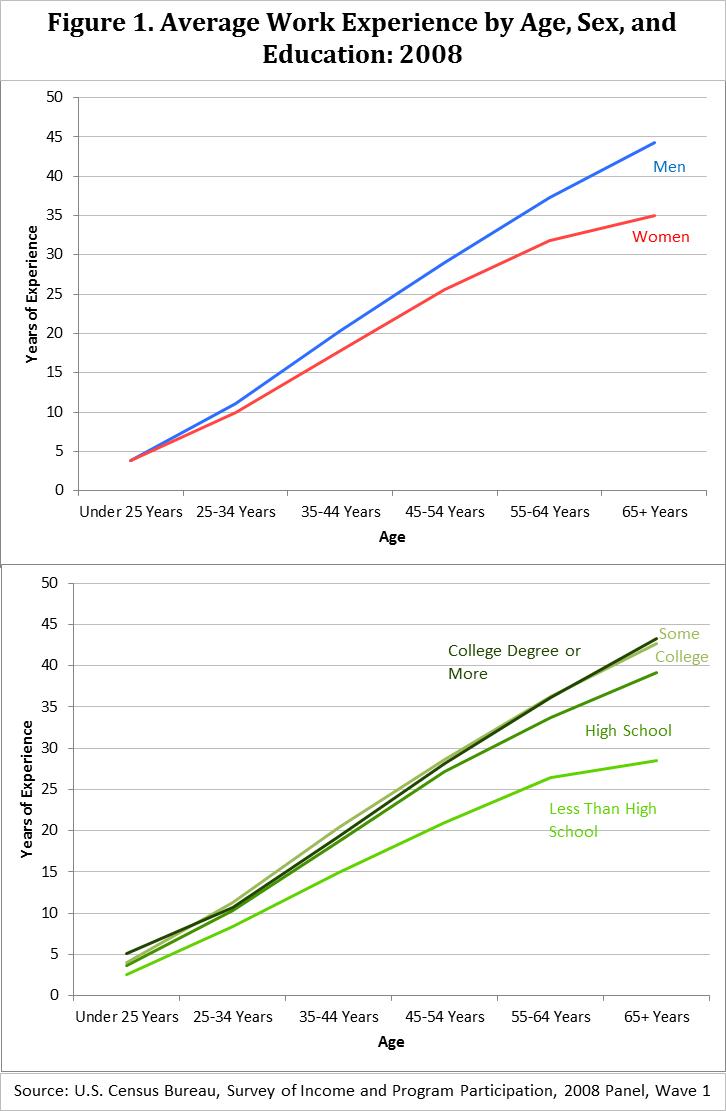
Figure 1 shows work experience by age separately for men and women and for levels of educational attainment.

Figuring showing work experience for men and women and level of education

We can see that women have similar levels of experience as men early in their careers.  However, on average, women accumulate experience more slowly starting around age 25. This information comes from the 2008 SIPP and  is consistent with mothers staying home with young children more often than fathers do (for additional information on the ages of mothers and those who stay home, see  America’s Families and Living Arrangements: 2007 and Births: Final Data for 2008).

We also found that working-age people without a high school degree (or equivalent) spend less time working than their peers. High school graduates of every age group have more work experience than people without degrees in the same age group. The difference grows as they age; people without a high school diploma gain an additional 4.6 years of experience as they age from 22 to 30. Those with a diploma gain an average of 5.9 years of experience.

The SIPP data have rich information about earnings.  For information about how work experience and length of time with a particular employer is associated with earnings, please see www.census.gov/people/laborforce/.

For detailed statistics by age, experience and job tenure, please see www.census.gov/people/laborforce/publications/employment_history.html.

Posted in Economy, Education | Leave a comment

New Ways to Find a Fact

Bookmark and Share

Written by: Jeff Sisson

 Have you ever wondered about the median income of your hometown? Or maybe you just want to know the population. These are some of the questions our data users often ask, and it is feedback we are listening to as we continue to evolve American FactFinder from the version first released two years ago.  Over the past 12 months, we have been working to improve American FactFinder based on feedback we have received since the initial launch in January 2011.

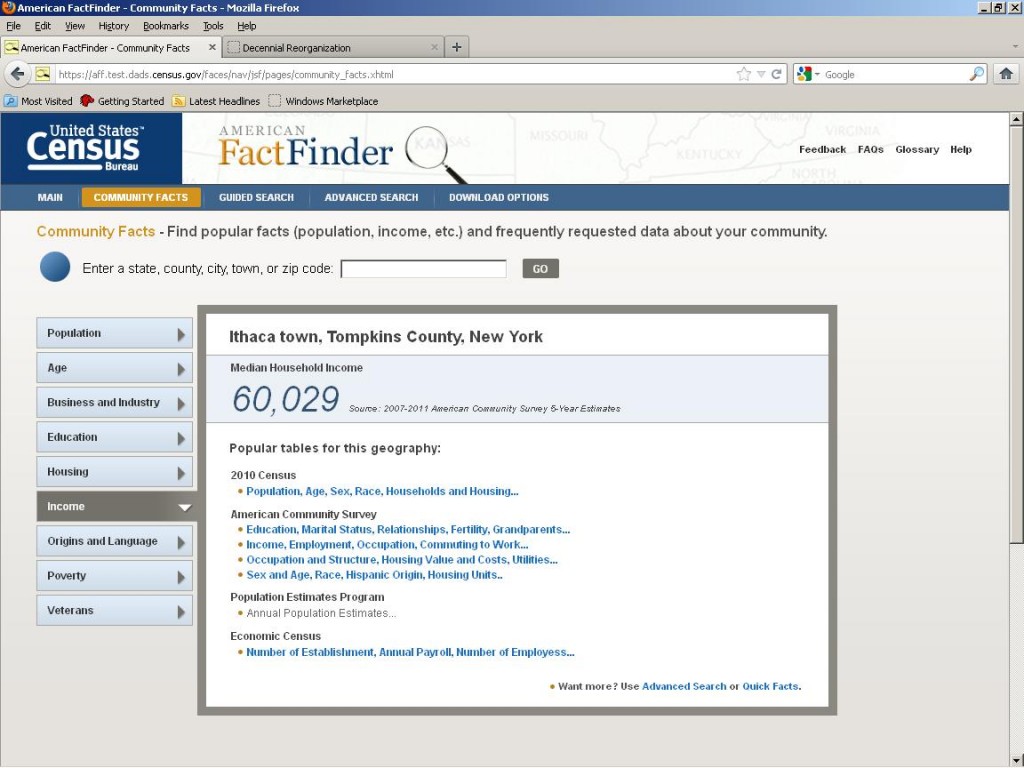
Today we released two enhancements to help FactFinder users find the statistics they need, whether they are experienced with our site or brand new to it. Community Facts will give users easy access to data about a state, city, town or ZIP code. Once you enter a geography, just hit “go” and you will have immediate access to popular facts, such as total population, median age, educational attainment, median household income and individuals below the poverty level. For example, when I look up my hometown of Ithaca, New York (the town of Ithaca), I find the median income is $60,029.

Screenshot of Community Facts

You can then explore related tables linked below each fact to see more statistics from popular data sets, such as the American Community Survey, which provides annual detailed local-level statistics for even the smallest areas.

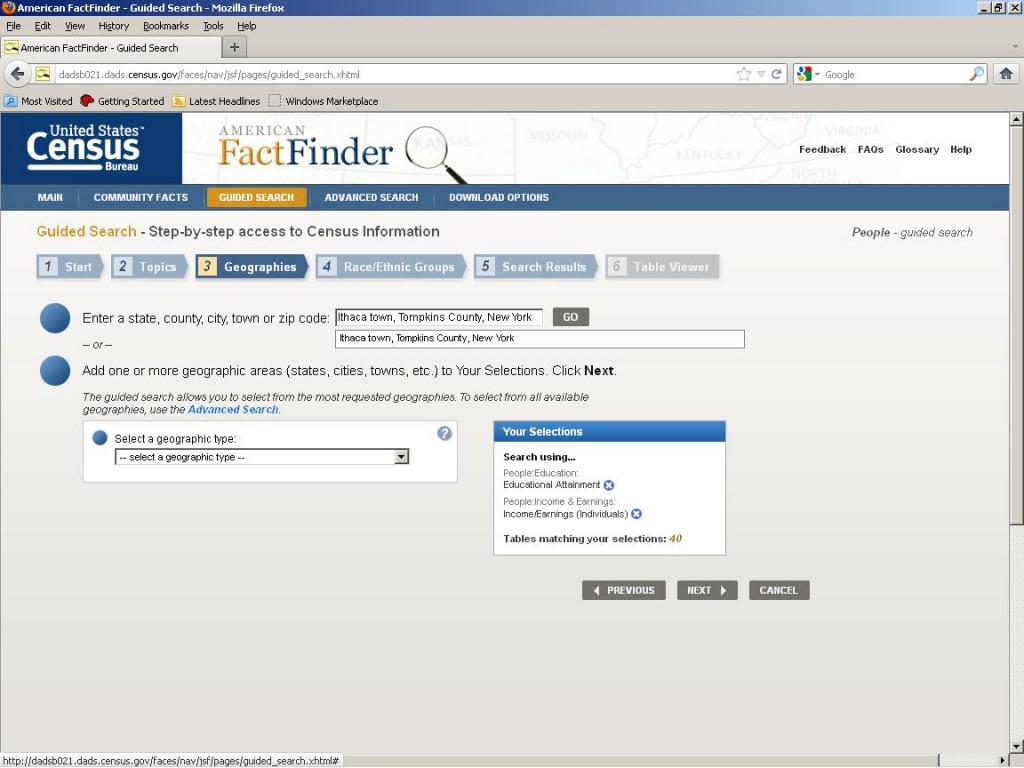
In addition, if you need a little more help navigating to a specific statistic, you can now use our Guided Search feature. It will lead you step by step through your search, starting with asking you what type of information you need (such as information about people, housing or business and industry) and then asking you to narrow down by topic, geography (such as a city, town or even census tract), and in some cases races or ethnicity. If you are not familiar with using our data, this may be the option for you.

Screenshot of Guided Search

For experienced data users, never fear, you can still use the FactFinder you are familiar with by going to the Advanced Search option. And while not as significant as Community Facts or Guided Navigation, we have improved advanced search by enhancing the Search Within Results features as well as other minor enhancements.  In addition, you will now find a link from the FactFinder home page to download options, which provides information about the various ways you can download data from American FactFinder, as well as links to other download resources.

These updates are based on your feedback and are just one of the ways we are making our statistics and information easier to find, share, download and customize.

As we continue to measure America’s people, places and economy, we are giving you a variety of tools to access the data. The API we released last summer provides developers with the opportunity to create their own apps using Census Bureau data. Casual users can also find answers to a variety of data questions from visiting the census.gov homepage and using either QuickFacts or Easy Stats.

Posted in Data Tools | Leave a comment

2012 Economic Census Webinar Assists in Your Response

Bookmark and Share

Written by: Bill Bostic

The 2012 Economic Census is now in full swing and businesses throughout the U.S. have received the questionnaire.  On Jan. 24, 2013, at 1 p.m. EST, we will host our second webinar.  This hour-long instructional webinar provides information for businesses who are preparing to respond to the 2012 Economic Census.  The webinar will cover the following topics:

  • Your reporting options, including our NEW Direct Internet Reporting system and a demo of this tool
  • Tours of the Business Help Site and business.census.gov websites
  • Materials available to help make reporting easier
  • Information for associations, chambers of commerce, and the media to use to promote response to the economic census

No preregistration is required.  For more information on how to participate, visit the webinar page at business.census.gov/webinar.

Our first economic census webinar was held on Oct. 11, 2012, and focused on why businesses should respond to the 2012 Economic Census and how industry organizations could assist them.  If you missed the first webinar, you can find links to the presentation and other materials at business.census.gov/webinar.

Forms went out to nearly 4 million businesses, including large, medium and small companies representing all U.S. locations and industries. To create a snapshot of the American economy, the census asks businesses to provide basic information on revenue, employment and payroll, and industry-specific topics such as the products and services they provide.

This information provides reliable business statistics that are essential to understanding the American economy.  Businesses use economic census data to compare their operations to industry norms, find markets, and to inform key decisions, including are your employees as productive as the industry average?

Mark your calendar now, and find out why response makes a difference!

Posted in Uncategorized | Leave a comment

Census Data Mapper: Beta Version Now Available

Bookmark and Share

Written by:  Stephen F. Jones

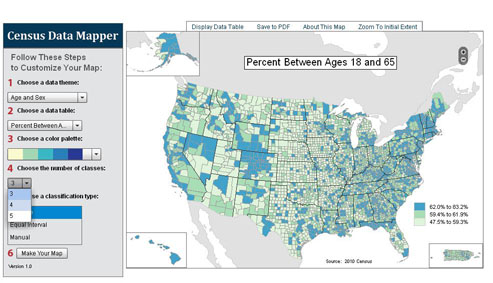
Are you interested in creating maps that display 2010 Census Population and Housing data for use in reports, presentations, or general viewing?  If so, then the Census Data Mapper is an application you should explore.  The beta version of the application is now available for use at the following URL: http://www.census.gov/geo/maps-data/maps/datamapper.html.  

image of census data mapper


This web mapping application provides users with a simple interface to view, customize, save and print thematic maps of the United States, using data from the 2010 Census.  The beta version contains a set of 2010 Census data relating to age and sex, population and race, and family and housing in the United States by county or equivalent entity.  The map design and layout were created by Census Bureau cartographers and are similar to that used on standard Census Bureau map products.

Software Functionality

Users can customize the map display by choosing the number of data classes, selecting from a series of predefined fill colors, and selecting the type of data classification. 

The interface also allows users to explore the data sets by viewing information on the map and in tabular form.  Selecting a geographic unit on the map will result in the corresponding value in the data table being highlighted and vice versa.

Maps created within the application can be saved to your computer in PDF format and subsequently viewed and printed through Adobe Acrobat Reader.  The PDF will be a finished map product containing only the map image, and not the other graphics from the web page, and suitable for use in presentations and reports.

Future Plans

The current beta version of the software contains just over 20 data items from the 2010 Census, but future versions will include many more and may also include other data sets.  Future versions may also include data and maps for different levels of census geography. 

For future software releases, we are exploring new ways to improve the quality of the map and reduce file size.

The Census Bureau is interested in getting feedback from users on the usefulness of the application and desired future enhancements. We hope you will provide us with your comments, suggestions, and future needs so we can improve the product in future releases.  Please email responses and feedback to geo.geography@census.gov.

Posted in Uncategorized | Leave a comment

What a Difference Four Years Make: U.S. Population Projected to Grow at a Slower Pace Over the Next Five Decades

Bookmark and Share

The U.S. population is projected to grow at a slower pace over the coming years than was projected four years ago, according to new population projections released today. So, how much is the U.S. population expected to grow over the next several decades?  Moreover, how and why has the projected growth rate of the population changed between the 2008 and 2012 series?

What difference does four years make?  The population projections are based on assumptions about the future levels of fertility, mortality, and international migration that are based on past trends. The new series of projections incorporates data that are more recent on births, deaths, and net international migration.  Fertility and international migration have declined in recent years. The annual number of births in the United States has been declining since 2008, while the number of net international migrants began to decline after 2001. Growth of the population is contingent on births, deaths, and migration. Declines in births and migration reduce the population’s growth rate, while decreases in deaths increase population size.

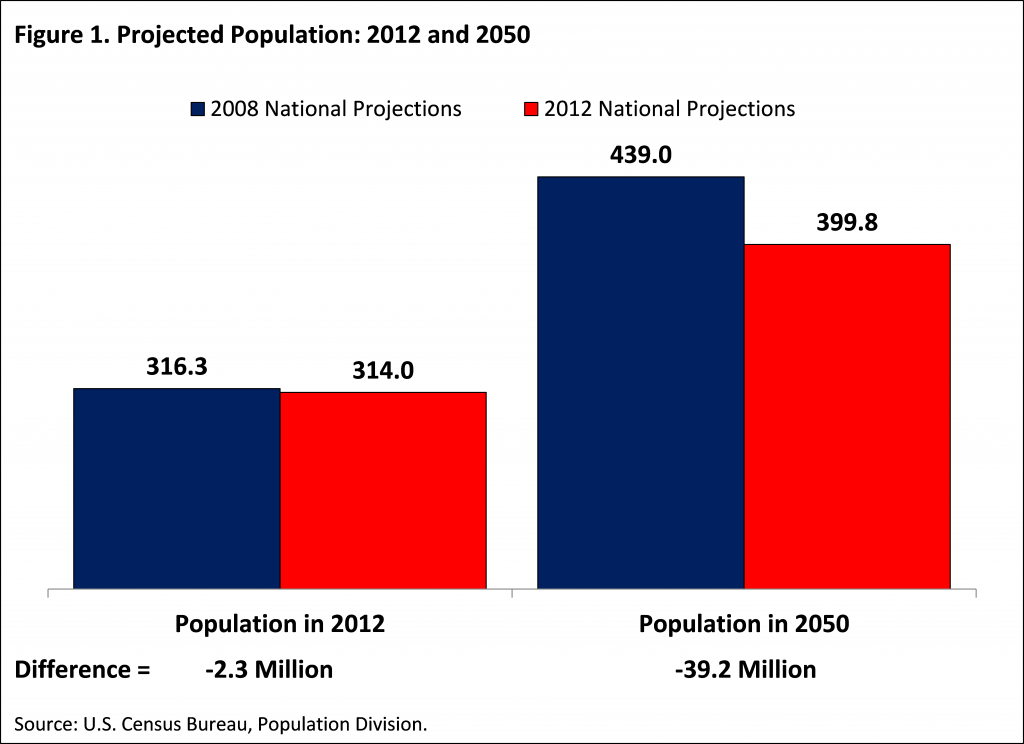
According to the 2012 National Projections, the U.S. population is projected to be around 399.8 million in 2050.  In the 2008 series, the population was projected to be around 439.0 million.  The new series projects 39.2 million fewer people living in the United States in 2050 than the 2008 series (Figure 1).

pop projections

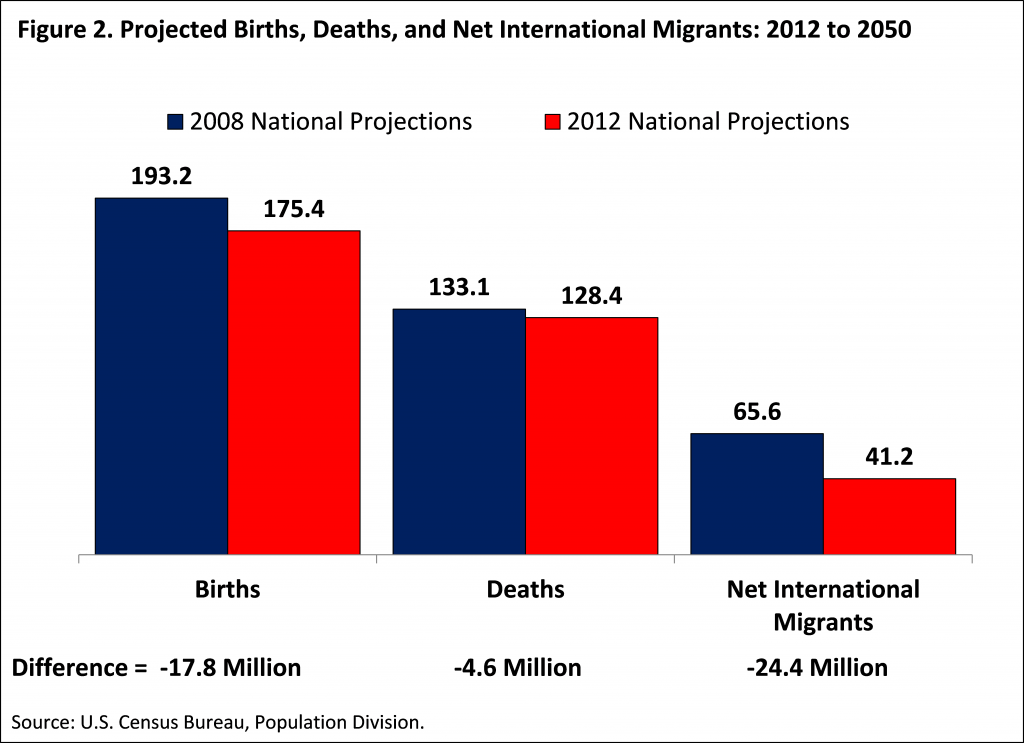
What is driving this difference?  The most important driver is international migration (Figure 2).  The 2012 series projects 41.2 million net number of international migrants, while the series released in 2008 projected 65.6 million net migrants – a difference of 24.4 million. The next largest driver of this difference is the projection of births.  The 2008 series projected 193.2 million births to occur between 2012 and 2050.  The 2012 series projects fewer births, just over 175 million for the 38-year period. The total number of projected deaths was also lower in the 2012 series, which projected 128.4 million compared to the 133.1 million deaths projected in the 2008 series (a difference of 4.6 million).  Finally, the 2012 National Projections are based on a smaller population in 2011 than what was projected in the 2008 series.  In 2011, the Census Bureau estimated there were 311.6 million people living in the United States.  This estimate is 1.6 million lower than the projected population in 2011 from the 2008 National Projections.

When we add up the numbers, 24.4 million fewer migrants plus 17.8 million fewer births minus 4.6 million fewer deaths plus 1.6 million difference in the estimates of the population for the population in 2011, we arrive at the total difference of 39.2 million.

figure 2 pop projections

More information about the Census Bureau’s population projections, including the new series of tables with results from the 2012 National Projections, is available at: http://www.census.gov/population/projections/.

Posted in Population | Tagged , | 2 Comments