The South By Southwest 2013 conference is coming up quickly and we’re getting excited for the numerous library/archive and museum activities that will be happening (look for an update on this year’s activities soon).
One thing we know is happening is the panel we’re moderating on Why Digital Maps Can Reboot Cultural History. Matthew A. Knutzen, the Geospatial Librarian in the Lionel Pincus and Princess Firyal Map Division at the New York Public Library, will be part of the panel and we couldn’t be happier.
In this installment of our Insights interview series, we’re excited to chat with Matt about the work of the Map Division and their innovative approach to developing and utilizing digital geospatial tools and technologies.
Butch: Tell us briefly about what the Map Division at the New York Public Library does and the philosophy behind it.
Matt: The Map Division, officially known as the Lionel Pincus and Princess Firyal Map Division, is both a wonderful collection of close to 1/2 million maps and 25,000 books and atlases as well as the beautiful reading room from which those collections are served. Being a public library map collection, we are committed to serving a wide gamut of patrons from school children to accomplished scholars. Increasingly this means creating digital surrogates and making those surrogates more and more useful within the context of the networked environment of the web. I suppose then our philosophy is one driven by building, increasing and maintaining open access to our collections to the greatest number of users in both the physical and digital contexts.
Butch: Tell us briefly about your background and how you ended up at NYPL Maps.
Matt: My background is in geography, cartography and fine art. I have a BA in Geography from the University of California, Berkeley and an MFA in Painting from Pratt Institute, although I actually did very little by way of painting while there. I ended up coming to New York in 1998 to do my Masters Degree because I’d been consumed by my fine arts practice, that is, it felt more weighty and important than my work as a production cartographer, as satisfying as that was. I quickly fell into a painterly existential crisis (I was in art school after all) and abandoned painting altogether. What emerged in my artmaking could loosely be described as abstract cartography, the likes of which we’ve seen quite a bit in the last few years. And like so many former grad students, I came away in debt and looking for meaningful and paying work. I spent some time as an art handler in art galleries and as a graphic designer in an architecture firm, but ultimately, was led to the Map Division by a freelance cartography job, where I found my home.
Upon entering the reading room, browsing the catalogs, finding what I was looking for, I told the librarian on the desk, former Chief of the Map Division, that I could live in a place like this, then proceeded to ask her if they had any openings. As fate would have it, they did. The Assistant Chief position was open and I, with my recently minted MFA and my experience as a cartographer was welcome to apply.
Butch: Tell us about the New York City Historical GIS project and the Map Warper tool. How is the New York City Historical GIS project different from other mapping projects that work to make historic mapping materials more accessible?

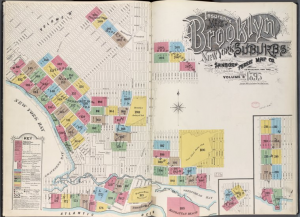
Insurance Maps of Brooklyn New York Sanborn Perris map co. 113 Broadway, New York. Volume “B” 1895. Photo Courtesy of the New York Public Library.
Matt: The NYC Historical GIS is a three year NEH funded project that moves a significant portion of our New York City map collection in to the digital space. It does so first through scanning, in this case we’ve run approximately 12,000 maps (published from 1850-1922) in front of the NYPL digital cameras, creating high resolution copies for public consumption. Most of those initial images are Fire Insurance Maps, many published by the Sanborn Map Company. These are some of the most highly detailed documentation of the built environment, incredibly important to historians, urban archaeologists, scholars of the historical environment in terms of the physical, economic, social or architectural landscape. As we noted in our application, there are too numerous to name types of uses we’ve seen in the public reading room throughout the years. So, aside from digitization, this project runs scanned map collections through two other processes that increase the value of these scanned digital objects.
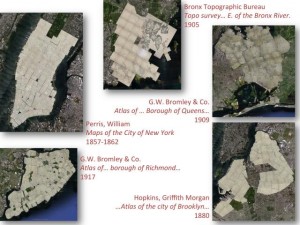
First is Georectification, or rubber sheeting. This process, well known to those versed in the language of Geographic Information Systems, is the first essential step to making maps machine readable. What’s involved is aligning pixels on digital photos of old maps to the location of the place depicted on a vitural model of the Earth. Think of the way Google Earth looks, like a patchwork quilt of digital information. It looks this way because it is a series of digital map/aerial photo data that’s been georectified and stitched together.
We built a tool called the Map Warper for processing our collection this way and have, in part through the NYC Historical GIS project, georectifed more than 5,000 maps. The cool thing that happens once you georectify one map, is that you can do so with multiple maps of the same area, and then do a before-and-after kind of comparative analysis of geographic places.
So the next process that this grant has allowed us to do is tracing. We’ve all heard how optical character recognition can make the contents of a document searchable by keyword or phrase, but there’s no equivalent for maps. Maps are simply too complex, an amalgamated hodgepodge of points, lines and polygons with text of varying size, typeface, kerning, spacing going every which way and overlapping graphical features.
The complexity of the graphic language, the cartographic conventions, the stylistic variations and the like make maps a hard nut to crack for the pattern recognition and image matching algorithms as employed by OCR. So, we do it by hand. Once a map or series of maps like an atlas have been georectified, we make it possible to trace the map’s features, its points, lines and polygons, and additionally, we encourage users to input attribute data that relates to those features.
For example, if you had a map that had the building footprint of the New York Public Library, we’d ask that you input the name and the address of that building. Once we’ve done this, the atlas itself then becomes a query-able digital object.
So we see this data then becoming like the data backbone for the study of historical places. We’ve transcribed so far more than 110,000 historical building footprints for New York City, most from Manhattan in the middle 19th Century. What this can do for us, for example, is enable us to search for and learn about places which have been effectively hidden in the historical record, places by virtue of the fact that they are no longer named what they were then named, that are lost. Many streets, for example, have undergone name changes, and many address numbers, have been modified or moved around. A researcher then, looking to study a place, might not even be aware of the appropriate search terms to find information about historical places buried deeply in the historical record.
Butch: Map-making is really about storytelling across geographies. What attracted you to use maps as your storytelling mode (as opposed to video, audio, other interactive)?
Matt: My background is in geography, cartography and map-based visual arts, so maps have always played a central role in the telling of stories. One of the things that really attracted me to cartography in the first place was its ability to tell stories of landscapes transforming across time, a nice complement to my studies in geography too, and particularly for my somewhat visual approach to learning as well as my interest in the study of history. Maps provided a means to pack massive amounts of data into one frame of reference, even when they are printed maps. They tell stories that are understood quickly, easily, succinctly, pithily. They have a gestalt that a thousand tables of data does not, and they surface the spatial connections, as any geographer can tell you, in and among those data points.
Butch: How have the technologies of digital mapping changed over the past five years? How have those changes affected the work you do?
Matt: Digital mapping has utterly, completely and totally transformed the world of cartography as well as that of map librarianship. The job descriptions of cartographers have grown to include hacking, programming and on the whole, an understanding of the web, with its protocols, languages and new user experiences.
Moreover, so much of the cartography produced today will never be printed and so, the approaches to cartographic design have totally shifted. A single sheet or two sided map or multi-page guidebook or atlas is often now designed instead as new digital instantiations, marked by interactivity, scale dependent rendering, typographic placement by way of algorithms and non-linear, non book map experiences. I find it amazing too, that while these are profound shifts, they are dependent and rooted deeply in technologies that are very very old, like the Mercator projection (ca. 1569) and gazetteers (place name dictionaries–ancient Babylonia!).
As a map librarian, I’ve watched many of our routine information retrieval functions migrate to the web, beginning with basic place finding queries (“where is Mongolia?”) moving to more in-depth way-finding queries (“how do I get from New York to Montana?”) to more complicated, spatial queries like “where is the closest sushi restaurant?” to increasingly, complex spatial and temporal queries like, “what do maps tell us about how Times Square looked like 60 years ago?”
It’s the last question that libraries with historical map collections can really play an important role in helping to answer because we hold the historical data that any such question is predicated on. That kind of spatial plus temporal query is the one that drives me forward in much of what we do with maps at the NYPL.
Butch: Where are the current gaps in terms of tools and services to help digital storytellers do their work with maps? What are some tools, approaches or initiatives that might remake the future landscape of digital mapping?
Matt: I’d like to see more tools that allow users to VERY simply tell stories on a map. Neogeography has been wonderful in enabling many people to quite easily compile information spatially, through things like flickr geocoding, geotagging of most photos tweets and social media posts, Google’s mapmaker, and through open mapping platforms like Openstreetmap. Increasingly it’s difficult to do anything with a mobile device that isn’t geocoded, so there’s this amazing explosion of spatial data.
But compiling this all into curated stories isn’t so easily accomplished. The technological threshold allowing the lay user to aggregate and compile this spatial data into meaningful narratives or interactive digital experiences is still relatively high. So, while some amazing leaps have been made, the tools that exist to do so are still somewhat in the realm of the technically savvy.
Butch: In the National Digital Information Infrastructure and Preservation Program we’ve started to think more about “access” as a driver for the preservation of digital materials. To what extent do preservation considerations come into play with the work that you do? How does the provision of enhanced access support the long-term preservation of digital geospatial information?
Matt: As we digitize maps, create georectified copies and transcribe historical digital vector spatial data from them, we do so, at least in the case of the NYPL, with an eye towards a future where this information can be put to good use in the service of enhancing access to digital collections that are only implicitly spatial, items such as photographs of buildings, playbills, menus, city directories. The historical spatial data can become the framework or armature upon which we hook enormous amounts of historical information, the means by which we conduct deeper analytical processes such as historical geoparsing, and newer, yet-to-be-built tools to conduct activities like historical geofencing or historical place checkins. So, as we build applications on this data, it becomes even more necessary to account for its long term preservation.
Butch: In the course of your workflow you incorporate already extant digital materials (images, documents) as well as create your own (digital maps). What role does your project take in the long-term stewardship of any of these materials? How does the work you do help secure the long-term stewardship of digital geospatial data?
Matt: In the work we do at the Library, we create digital surrogates of existing paper maps and atlases and we create new derivative data objects. At this point, we push our metadata and high resolution raster imagery into a preservation digital repository maintained by the NYPL. Our ultimate goal, however is to preserve composite digital surrogates with every downstream derivative data. So for example, a map will have its technical and bibliographic metadata, an untouched, uncompressed TIFF file, a GeoTIFF (if we have one), a clipping mask (if we have one), ground control points by which we create a georectified copy of the map, a clipped image, as well as any vector data we may have traced from those images.
Butch: How widespread is an awareness of digital stewardship and preservation issues in the part of the geographic community in which you operate?
Matt: I find it really interesting and somewhat terrifying to exist simultaneously in the worlds of digital cartography and map librarianship because mapmakers are often only interested in the latest, best, most up-to-date information, and perhaps not quite equally as often, in the preservation of yesterday’s spatial data, whereas map librarians are thinking of the long haul, in the stewardship and preservation of such data! Raising awareness among cartographers and agencies that produce spatial geodata is a first step in preserving this data but, as the Library of Congress, I’m sure, is acutely aware, the steps that follow are time, expertise and resource intensive. Bridging the gap between institutions that preserve geodata (historical the moment it’s produced, right?) is something that must be done.
Butch: What role can LAMs and other non-profits play in working with the private sector to promote the stewardship of digital geospatial information? Should LAMs take a more aggressive role in the early capture and preservation of digital geospatial materials or can they rely on the marketplace for early capture and preservation?
Matt: It is essential that LAMs come together to more aggressively ensure the (mega/tera/peta)bytes of data that are produced one day then thrown out the next because of either a lack of awareness or for the sake of expediency, represents a huge drain of our cultural patrimony, that record of past landscapes which, but for the efforts of digital preservationists, would be lost forever.


