Situation Update: Summary of Weekly FluView

Key Flu Indicators
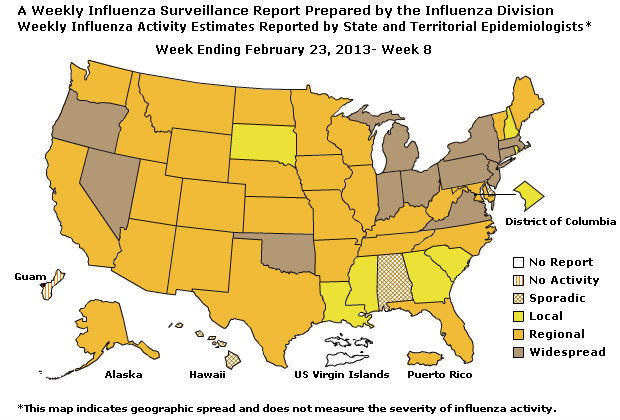
According to the latest FluView report, while influenza activity remains elevated in parts of the country, there continues to be a downward trend in activity nationally. Below is a summary of the key indicators for the week of February 17-23, 2013:
- For the week of February 17-23, the proportion of people seeing their health care provider for influenza-like illness (ILI) decreased for the fifth consecutive week with two regions moving below region-specific baselines.
- No states reported high ILI activity but 12 states and New York City continue to report moderate ILI activity for the week of February 17-23. Thirty-eight states reported low or minimal ILI activity. ILI activity data indicate the amount of flu-like illness that is occurring in each state.
- Twelve states reported widespread geographic influenza activity for the week of February 17-23; a decrease from 22 states in the previous week. Puerto Rico and 28 states reported regional influenza activity. Geographic spread data show how many areas within a state or territory are seeing flu activity.
- Since October 1, 2012, 10,227 laboratory-confirmed influenza-associated hospitalizations have been reported; an increase of 696 hospitalizations from the previous week. This translates to a rate of 36.7 influenza-associated hospitalizations per 100,000 people in the United States. The number of newly reported hospitalizations continues to decrease, though the highest number of cases continues to be reported among people 65 and older, who account for more than half of all reported hospitalizations.
- Hospitalization data are collected from 15 states and represent approximately 9% of the total U.S. population. The number of hospitalizations reported does not reflect the actual total number of influenza-associated hospitalizations in the United States.
- The proportion of deaths attributed to pneumonia and influenza (P&I) based on the 122 Cities Mortality Reporting System decreased this week, but remains above the epidemic threshold.
- Three influenza-related pediatric deaths were reported during the week of February 17-23, 2013. One of the deaths was associated with influenza A (H3) virus, and one was associated with influenza A viruses for which the subtype was not determined. One death was associated with an influenza B virus. This brings the total number of influenza-associated pediatric deaths reported to CDC for 2012-2013 to 81. Additional information regarding pediatric deaths is available through FluView Interactive.
- Nationally, the percentage of respiratory specimens testing positive for influenza in the United States during the week of February 17-23, 2013 decreased for the sixth consecutive week.
- Influenza A (H3N2), 2009 influenza A (H1N1), and influenza B viruses have all been identified in the U.S. this season. During the week of February 17-23, 605 of the 1,288 influenza-positive tests reported to CDC were influenza A and 683 were influenza B viruses. Of the 283 influenza A viruses that were subtyped, 86.2% were H3 viruses and 13.8% were 2009 H1N1 viruses.
- Since October 1, 2012, CDC has antigenically characterized 1,340 influenza viruses, including 105 2009 influenza A (H1N1) viruses, 827 influenza A (H3N2) viruses and 408 influenza B viruses.
- Of the 105 2009 influenza A (H1N1) characterized, 104 (99.0%) were characterized as A/California/7/2009-like. This is the influenza A (H1N1) component of the Northern Hemisphere vaccine for the 2012-2013 season.
- Of the 827 influenza A (H3N2) viruses, 823 (99.5%) were characterized as A/Victoria/361/2011-like. This is the influenza A (H3N2) component of the Northern Hemisphere influenza vaccine for the 2012-2013 season.
- Of the 408 influenza B viruses characterized, 71.8% belonged to the B/Yamagata lineage of viruses, and were characterized as B/Wisconsin/1/2010-like, the influenza B component for the 2012-2013 Northern Hemisphere influenza vaccine. The remaining 28.2% of the tested influenza B viruses belonged to the B/Victoria lineage of viruses.
- Since October 1, 2012, CDC has tested 298 2009 influenza A (H1N1), 1,267 influenza A (H3N2), and 446 influenza B virus samples for resistance to neuraminidase inhibitors this season. While the majority of the tested virus samples showed susceptibility to the antiviral drugs oseltamivir and zanamivir, two 2009 H1N1 viruses (reported during week 3 and week 6) showed a mutation indicative of resistance to oseltamivir. High levels of resistance to the adamantanes (amantadine and rimantadine) persist among 2009 influenza A (H1N1) and A (H3N2) viruses. Adamantanes are not effective against influenza B viruses.
FluView is available – and past issues are archived – on the CDC website.
Note: Delays in reporting may mean that data changes over time. The most up to date data for all weeks during the 2012-2013 season can be found on the current FluView.
![]()
Contact Us:
- Centers for Disease Control and Prevention
1600 Clifton Rd
Atlanta, GA 30333 - 800-CDC-INFO
(800-232-4636)
TTY: (888) 232-6348 - Contact CDC-INFO
