Skip Navigation
small NCES header image
Welcome to the International Activities Program! Side image - Untitled by Youm, Cambodia, 2008. Photography by Greg Staley. Artwork provided by VSA’s ArtLink program.Image Credits
Untitled by Youm, Cambodia, 2008.
Photography by Greg Staley.
Artwork provided by VSA’s ArtLink program.

Learn more about how U.S. education compares with education in other countries.

Find Statistics Now

Learn More About International Studies

Spines of several NCES reports

Snapshots from the International Data Explorer

Short, printable summaries of U.S. and state results on international assessments.
Hand taking multiple choice test

Assessments and Surveys

Information about the international studies in which the United States participates.
Composite graphic of various tables and graphs

Table Library

Comparative international education data in ready-made tables.
The ends of fiber optic cable

Other Sources

A guide to other sources of international information and data.
IDE Logo

International Data Explorer

Now Available - Analyze data from PIRLS, PISA, and TIMSS and create your own tables and charts using this on-line tool.
A white question mark on a red background

FAQs

Responses to frequently asked questions about international comparisons and international education data.
About the International Activities Program

NCES supports a variety of activities to provide statistical data for cross-national comparisons of education. Developing indicators and conducting international assessments and surveys are two main area of activities. Read more about IAP Read more about IAP

News and Highlights

New Releases! Results from the most recent international student assessments in reading, mathematics, and science were released December 11 in two new NCES reports. Learn about how U.S. 4th-graders compare with their peers around the word in reading here and how U.S. 4th- and 8th-graders compare in math and science here. Read the Commissioner’s Statement here.

What's the proportion of top students in the United States and how does it compare with other countries? How about the proportion of low performing students? And, how do the U.S. states that most recently participated in international assessments--Massachusetts and Minnesota--do on these measures? Two Snapshots From the International Data Explorer provide quick summaries of the international results on the proportions of top performers and low performers in education systems around the world.

The OECD's multi-volume international report with PISA 2009 results and PISA 2009 Profiles online tool are now available.

The PISA 2009 results are now available. Find out about U.S. student performance on PISA 2009 in the U.S. national report, Highlights From PISA 2009: Performance of U.S. 15-Year-Old Students in Reading, Mathematics, and Science Literacy in an International Context

Explore and analyze PISA data, including the just-released PISA 2009 data, using the International Data Explorer.

Trends in International Mathematics and Science Study (TIMSS) indicators are available in the 2010 Condition of Education.

Find out about U.S. student performance on international assessments in the supplement to the 2009 Condition of Education, U.S. Performance Across International Assessments of Student Achievement: Special Supplement to the Condition of Education 2009.

Read more IAP News and Highlights Read more IAP News and Highlights
Data Snapshot
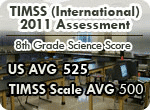
TIMSS (International) 2011 Assessment<br />

8-th GRADERS SCIENCE SCORE<br /><br />

U.S. AVG. :  525<br />
TIMSS Scale AVG. :  500

TIMSS (International) 2011 Assessment
8-th GRADERS SCIENCE SCORE

U.S. AVG. : 525
TIMSS Scale AVG. : 500

(Read entire article)


Would you like to help us improve our products and website by taking a short survey?

YES, I would like to take the survey

or

No Thanks

The survey consists of a few short questions and takes less than one minute to complete.