|
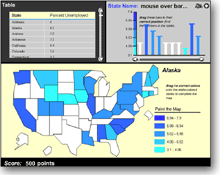
At the core of understanding the mapping of statistics is the ability to move between graphical and tabular data representations. "Data to Graphics" concentrates on demonstrating and exploring the connections between three alternative information visualizations: map, spreadsheet and graph. In "Data to Graphics" students learn the concept of linking a map, a table and a bar graph for data interpretation.
|
||||||
 |
|||||||
 |
|||||||
 |
|||||||
 |