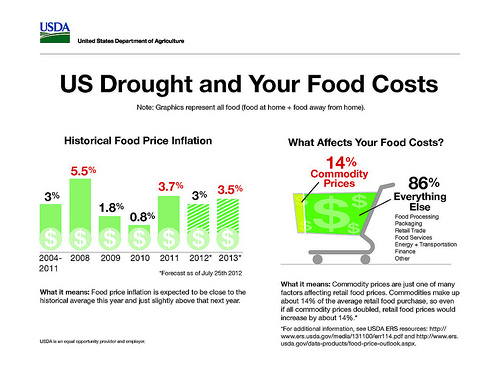
This info graphic demonstrate how the current drought, or any event that affects prices for raw farm commodities, ultimately has a marginal effect on what we pay at the grocery or restaurant. The info graphic is based on data from the USDA Economic Research Service's analysis of retail food prices and the food dollar, or all the factors that affect what we pay for food. (Click to enlarge)
In relation to the current drought, many people ask: What does this mean for food prices? Here we try to provide a response and the necessary context on food price inflation. The info graphic is based on data from the USDA Economic Research Service’s analysis of retail food prices and the food dollar, or all the factors that affect what we pay for food. The graphic helps to demonstrate how the current drought, or any event that affects prices for raw farm commodities, ultimately has a marginal effect on what we pay at the grocery or restaurant. Primarily, the graphic demonstrates two important pieces of information:
1. In the bar chart, food price inflation is expected to be close to the historical average this year and just slightly above that next year. As you can see, recent spikes from 2008 and 2011, especially, outpace current forecasts.
2. In the grocery cart model, you see that raw farm commodity prices (the price of things like a bushel of corn or soybeans) are just one of many factors affecting retail food prices. In fact, commodities make up about 14% of the average retail food purchase, so even if all commodity prices doubled, retail food prices would increase by about 14%. Together, factors such as energy and transportation costs, labor costs, processing and marketing costs all play a much more significant role.
On July 25th, ERS forecast that we will likely see impacts on retail food prices within two months for beef, pork, poultry and dairy. Yet the full effects of the increase in corn prices for packaged and processed foods (cereal, corn flour, etc.) will likely take 10-12 months to move through to retail food prices, and should have little to no effect until that time.
For additional information, see USDA ERS resources: A Revised and Expanded Food Dollar Series A Better Understanding of Our Food Costs (PDF) and Food Price Outlook web page.