
 CropScape is a geospatial data service which offers advanced tools such as interactive visualization, web-based data dissemination and geospatial queries and automated data delivery to systems such as Google Earth.
CropScape was developed in cooperation with the Center for Spatial Information Science and Systems at George Mason University and is hosted on their website.
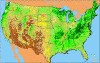
Land Use Strata for Selected States
 Animated U.S. choropleth maps of crop progress and condition state-level estimates greatly enhance current NASS offerings regarding crop progress and condition by more effectively showing the crop story to data users. Condition maps' sequential hues portray percent "good + excellent" for the crop by state, with weekly animated change. Their legend includes national condition. Progress maps' monochromatic shades portray percent progress for the crop data item by state, and their legend also includes the national 5-year average progress.

Research Reports by Date | by Title
Archived Research Reports GIS | Survey | Yield
Remote Sensing Uses - White Papers
2002 Maps: Gallery | Star Tree | List
"Linked Micromap" Plots (1997):
Corn | Cotton | Hay | Soybeans | Wheat
2007 Census Map Gallery
Last modified: 09/14/12
Remotely Sensed Data